English
  Русский
 Bahasa Indonesia
 Bahasa Malay
 ไทย
ไทย Español
 Deutsch
 Български
 Français
 Tiếng Việt
 中文
中文 বাংলা
বাংলা हिन्दी
 Čeština
 Українська
 Română

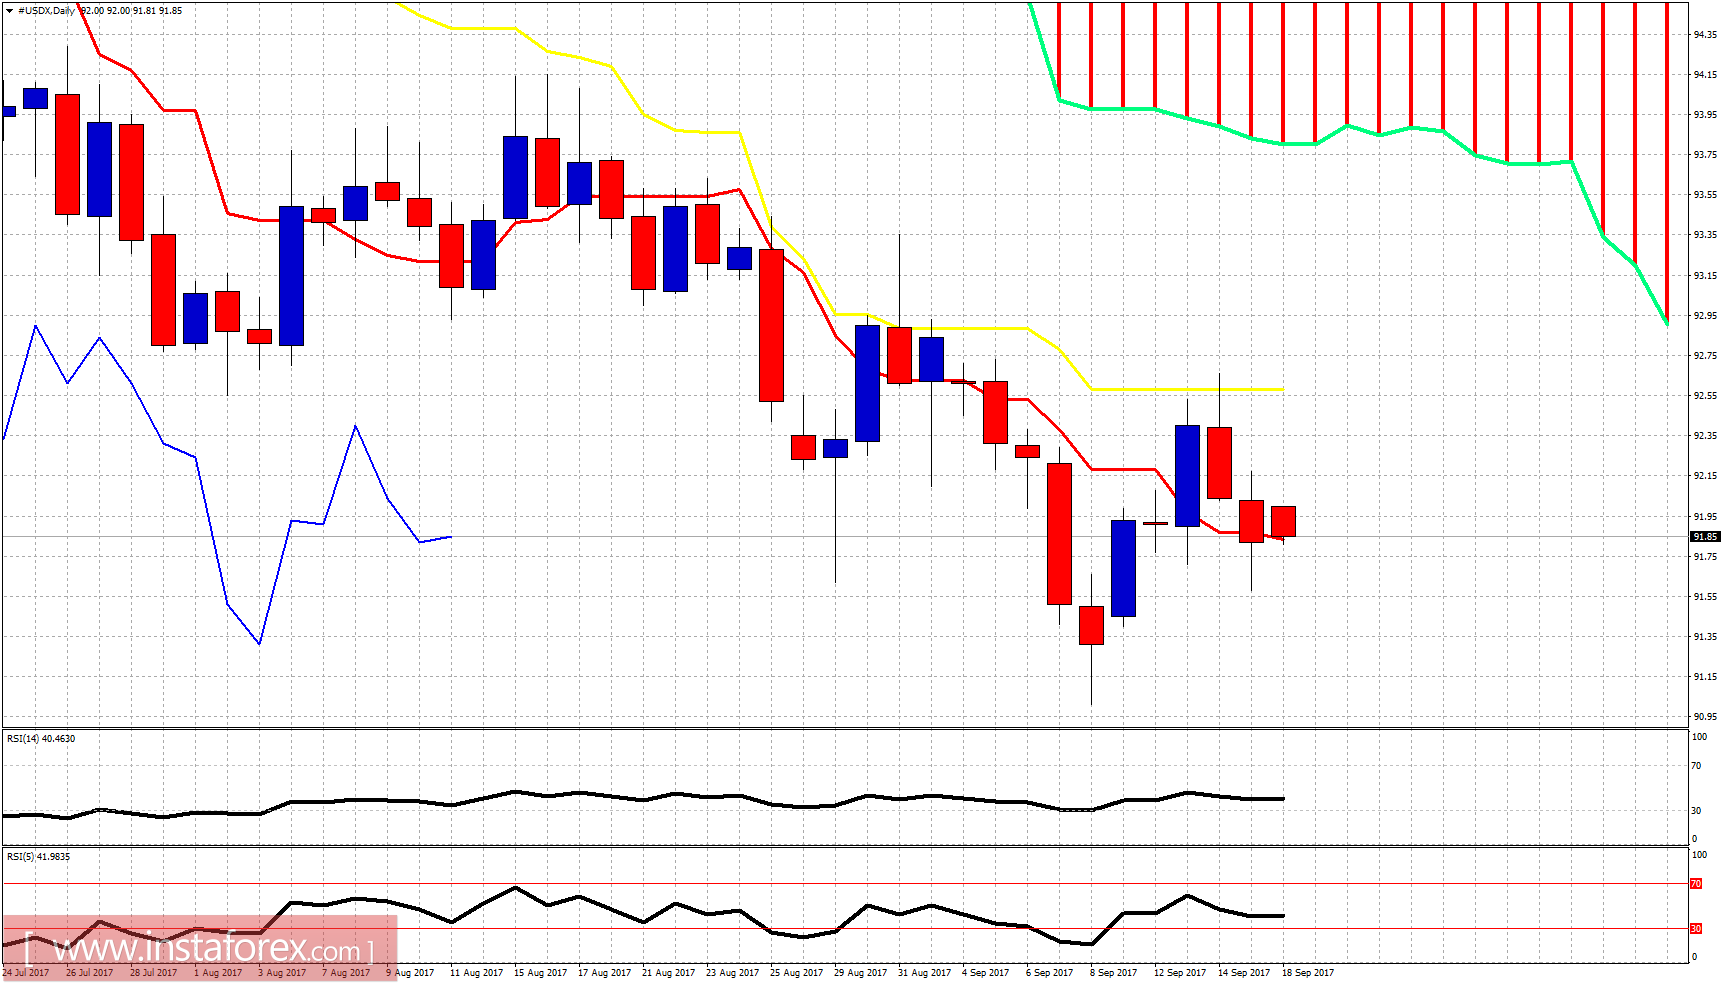
The Dollar index as expected completed its bounce at 92.50 area and reversed. Short-term trend remains bearish. I continue to expect the Dollar index to move below 90. The upward bounce was clearly corrective and not a larger trend change.
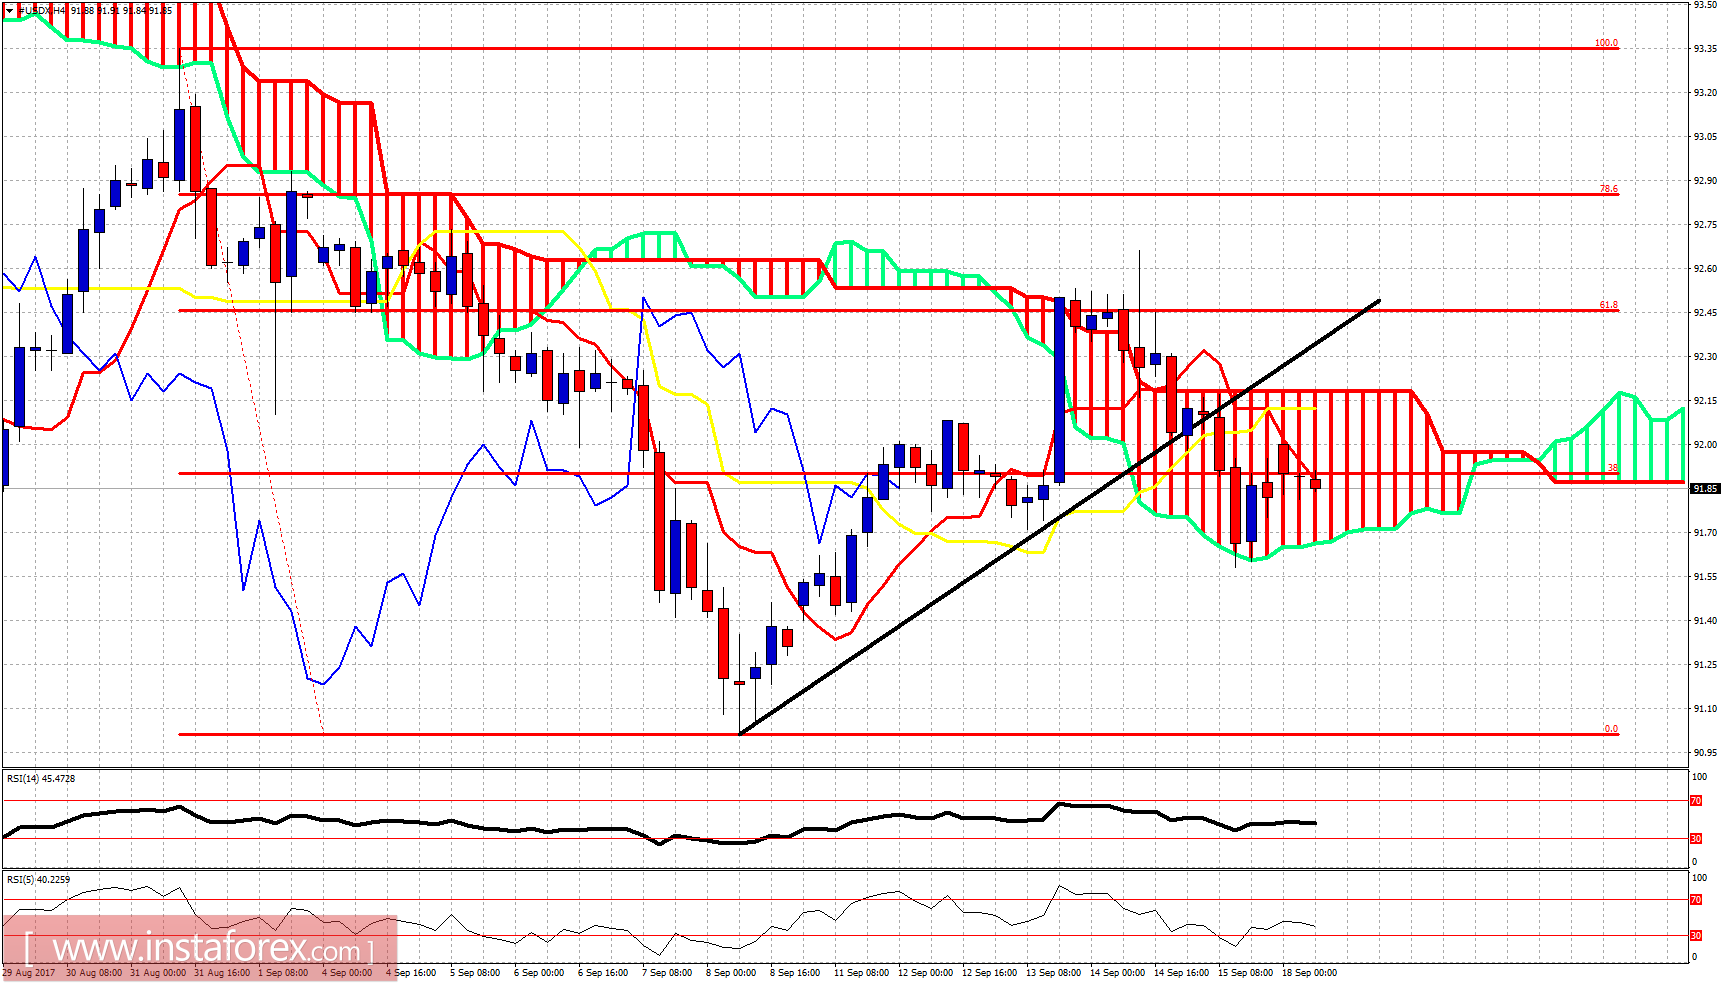
The Dollar index got rejected at the 61.8% Fibonacci retracement and has also broken below the black trend line support. Short-term support is now found at 91.65. Breaking below that level will confirm our view that we are heading towards 90 and lower. Short-term resistance is at 92.20 at the upper Kumo (cloud) boundary.