 English
  Русский
 Bahasa Indonesia
 Bahasa Malay
 ไทย
ไทย Español
 Deutsch
 Български
 Français
 Tiếng Việt
 中文
中文 বাংলা
বাংলা हिन्दी
 Čeština
 Українська
 Română

Gold price remains in a bearish short-term trend. Today Gold price mainly moved sideways but I believe we could see one more final new low near $1,299 before trend reverses to the upside.
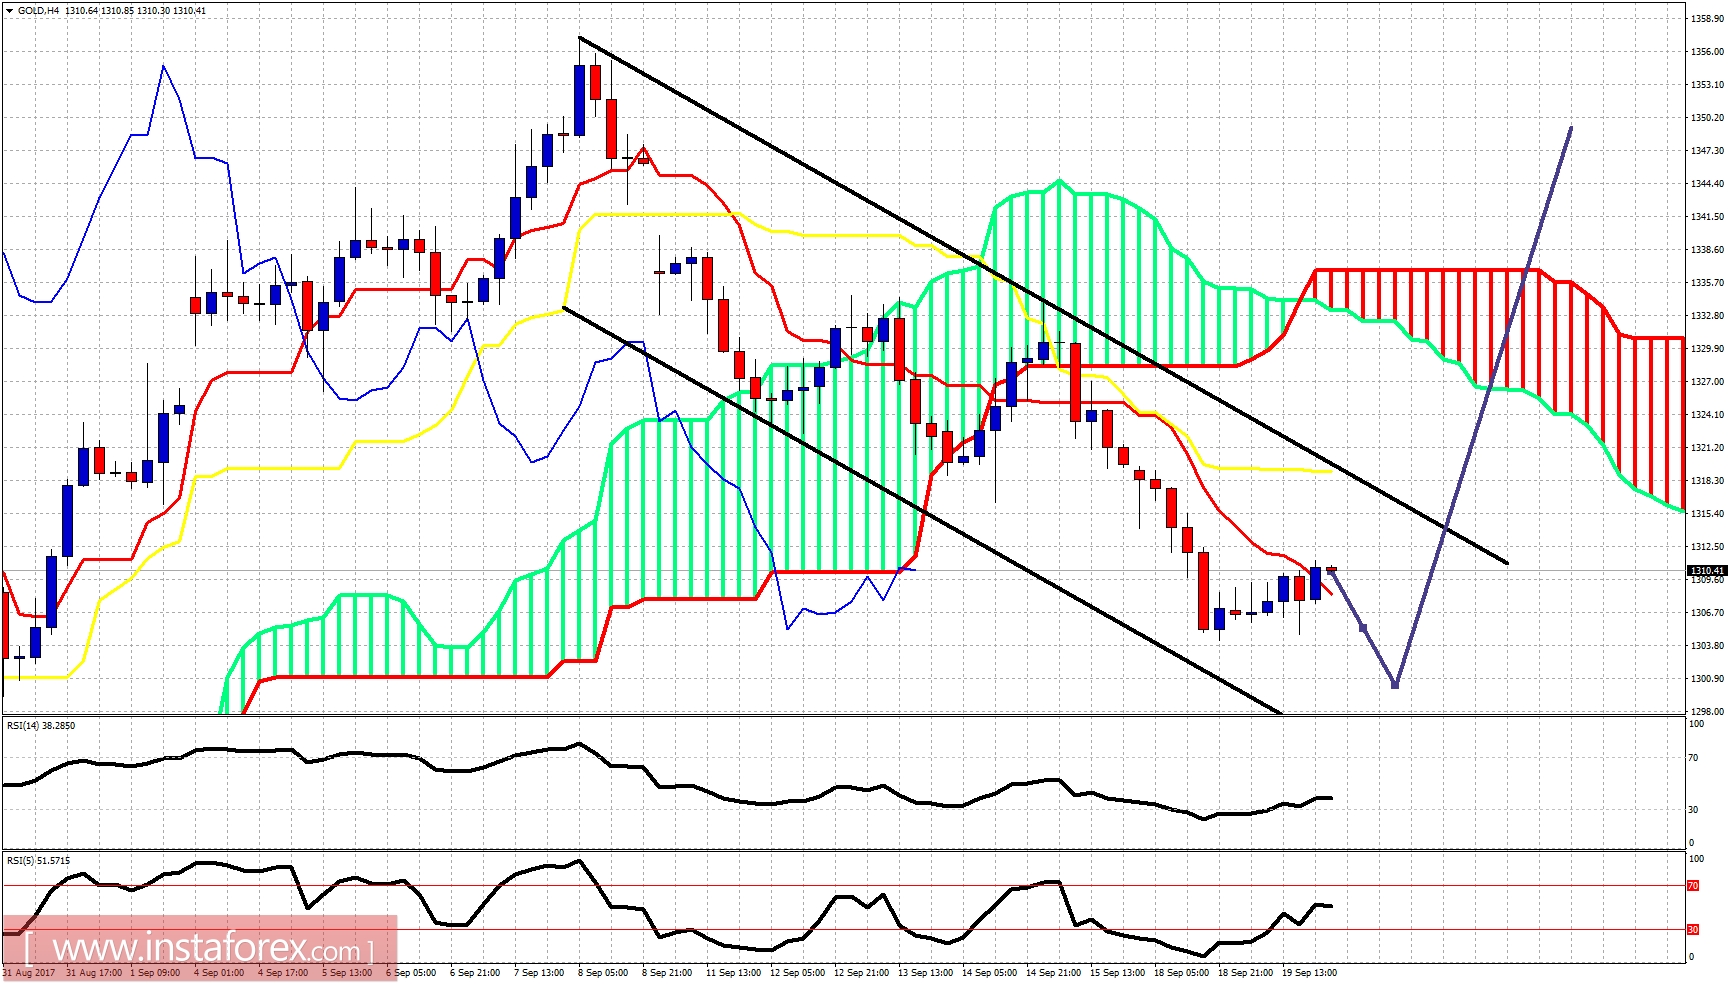
Black lines -bearish channel
Blue lines - price expected path
Gold price is inside the bearish channel and is trying to break above the 4-hour tenkan-sen indicator. Resistance is at $1,319 and support at $1,298. I expect one more new low and then a reversal towards at least $1,330.
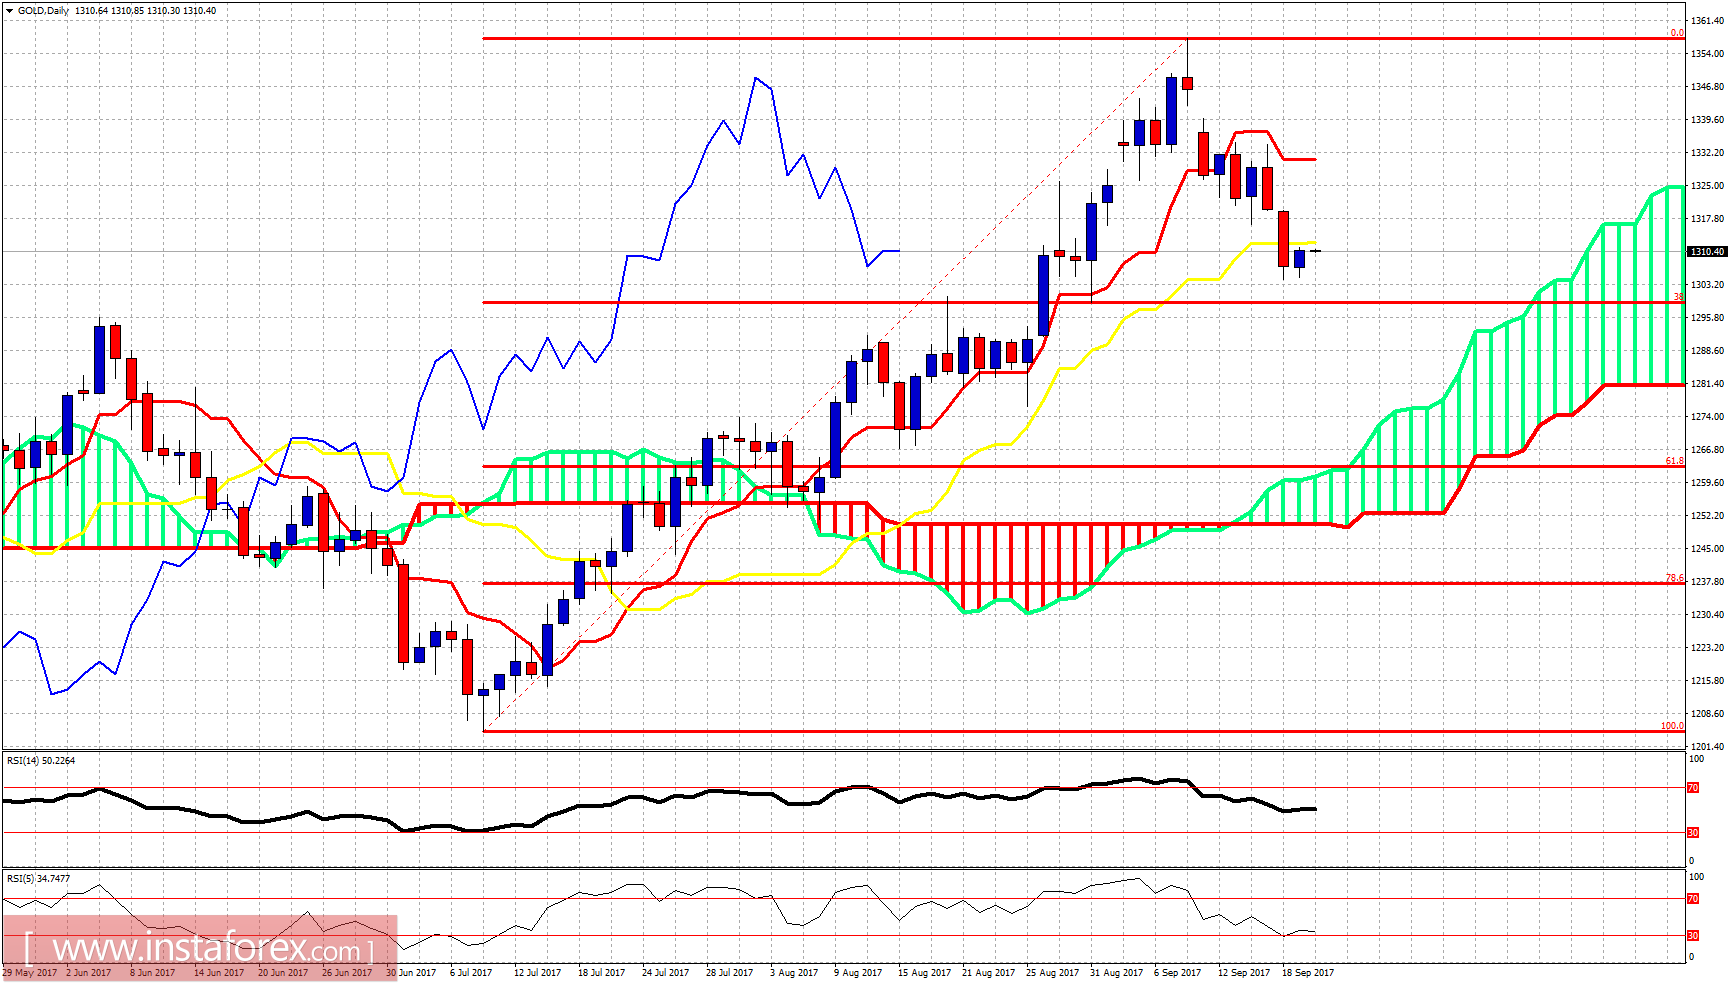
On a daily basis, Gold price has got very close to the 38% Fibonacci retracement. The minimum pullback has been made, so now we wait for a bounce at least towards the first important daily resistance at $1,335. I remain longer-term bullish and see pullbacks as buying opportunities.