The Dollar index is weakening in the short term. We could soon see a move to new lows around or even below 90. Trend remains bearish.
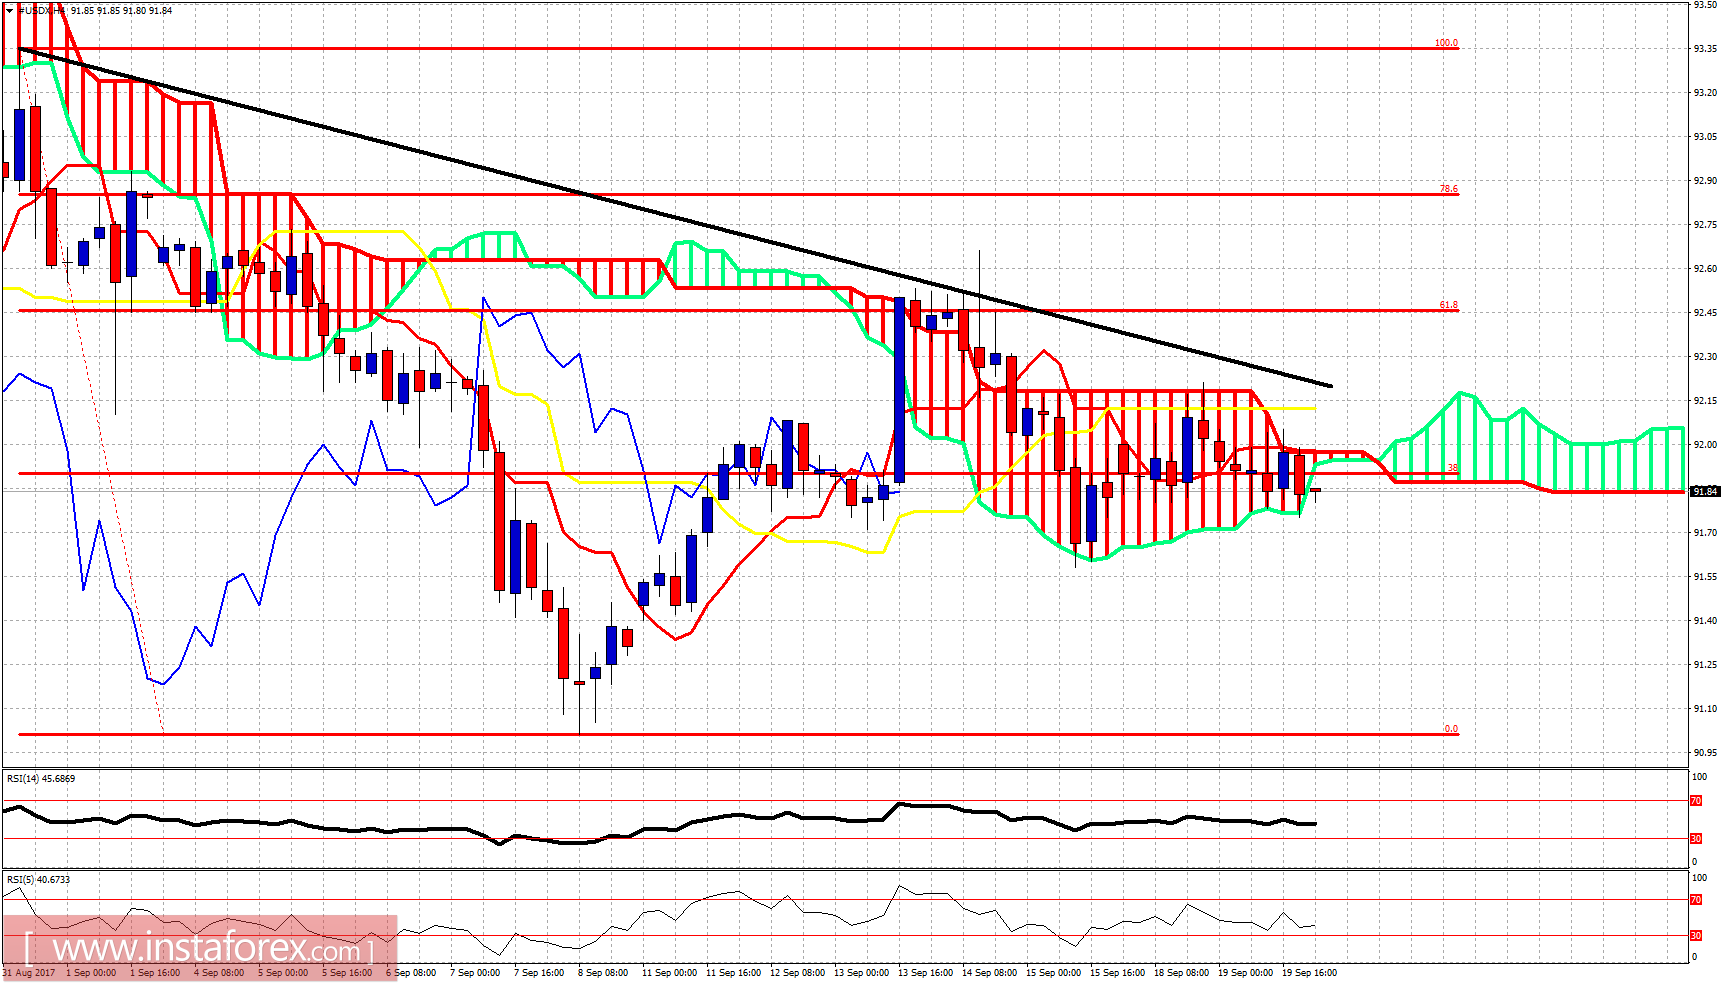
Black line -resistance
The Dollar index is trading below the black trend line resistance and is very close to breaking below and out of the Kumo (cloud). This would be a bearish sign, specially if it is combined with a move below 91.50.
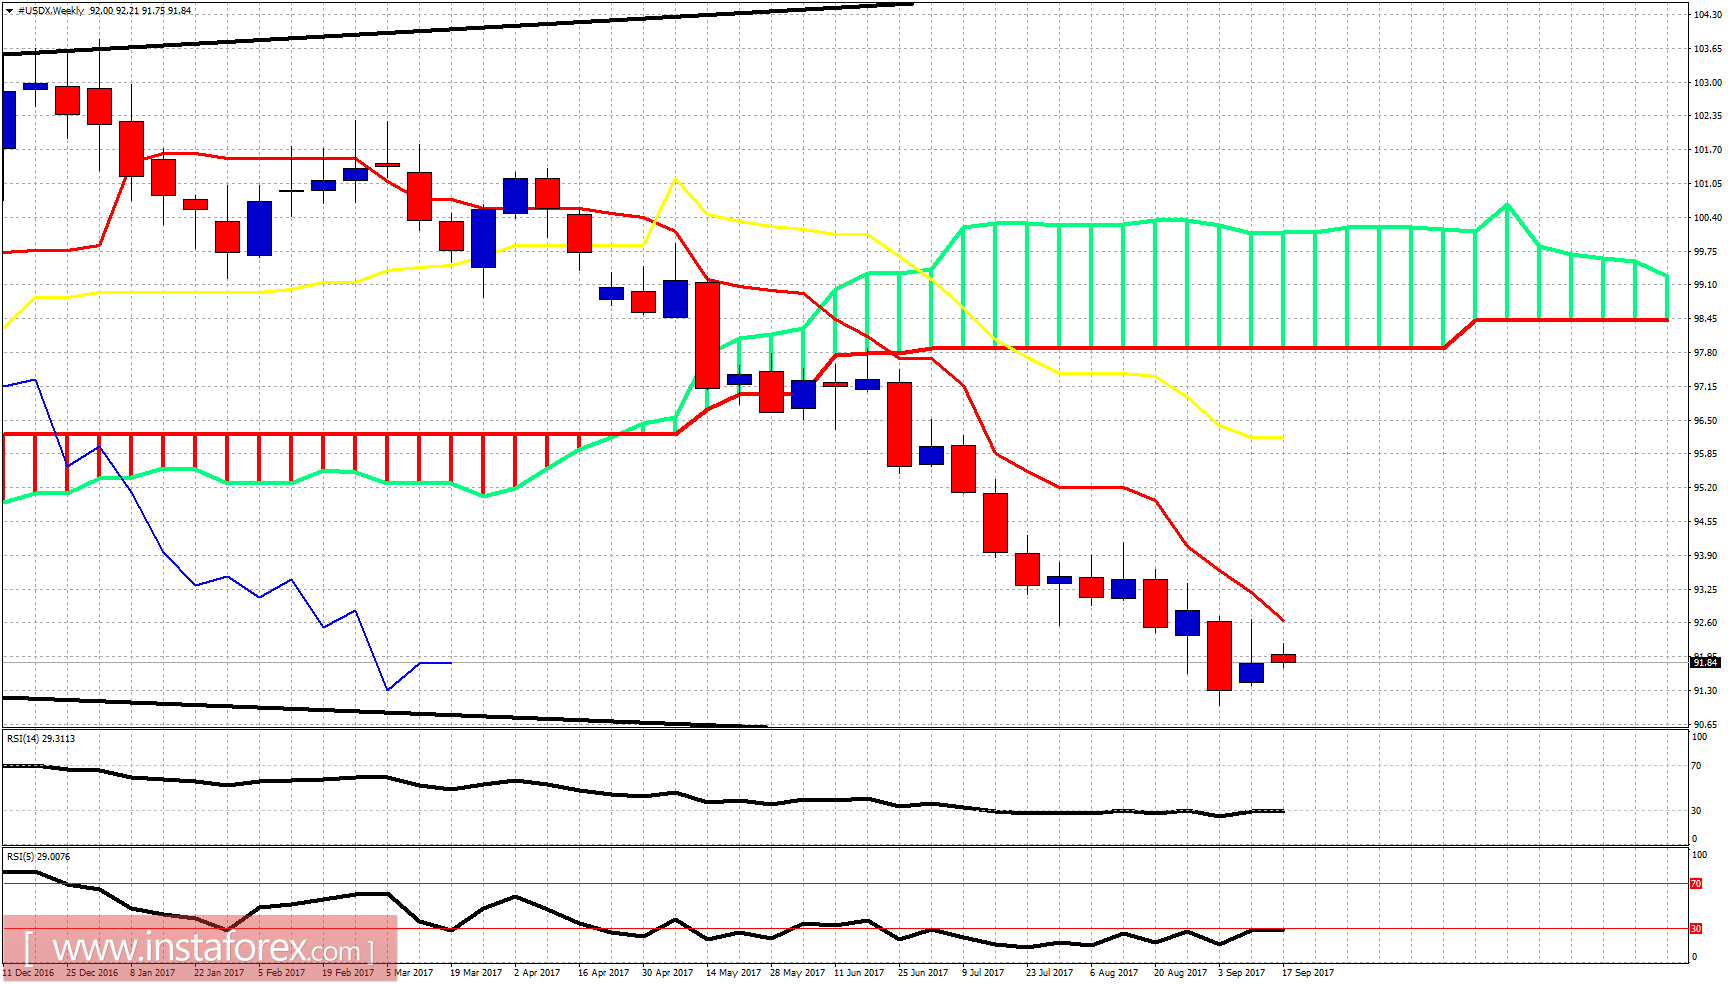
On a weekly basis, trend remains bearish. Price below both tenkan- and kijun-sen. A move towards 90 or lower is fully justified as long as price is below 92.70. Support is at 91.50 and if we see this level broken, we should expect price to accelerate lower towards 90.
*The market analysis posted here is meant to increase your awareness, but not to give instructions to make a trade
 English
  Русский
 Bahasa Indonesia
 Bahasa Malay
 ไทย
ไทย Español
 Deutsch
 Български
 Français
 Tiếng Việt
 中文
中文 বাংলা
বাংলা हिन्दी
 Čeština
 Українська
 Română
