The Dollar index spiked yesterday after the FOMC. Price is testing weekly resistance levels at 92.50. So far we consider this upward bounce as a corrective play in a larger down trend.
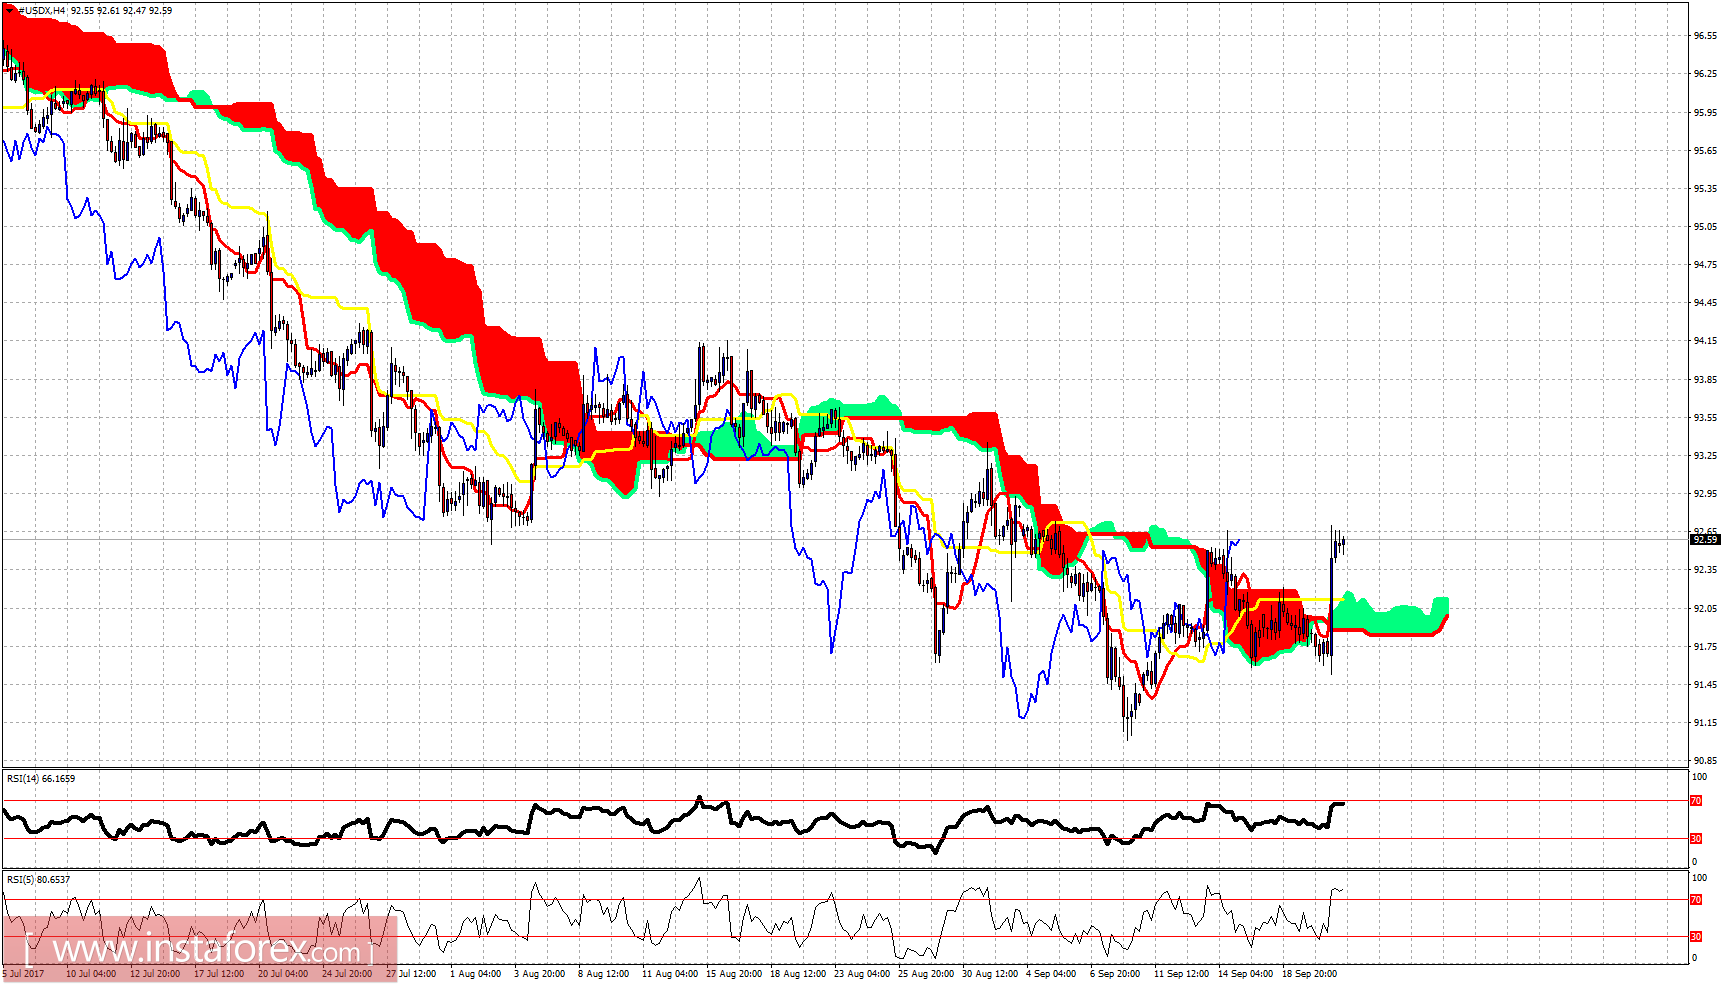
The Dollar index has broken out of the Ichimoku cloud in the 4-hour chart. This is a bullish sign. The Dollar index is however diverging. So a pullback towards cloud support at 92.10-92 is justified. Bulls will then need to hold above support. Otherwise we will see this breakout as a fake one.
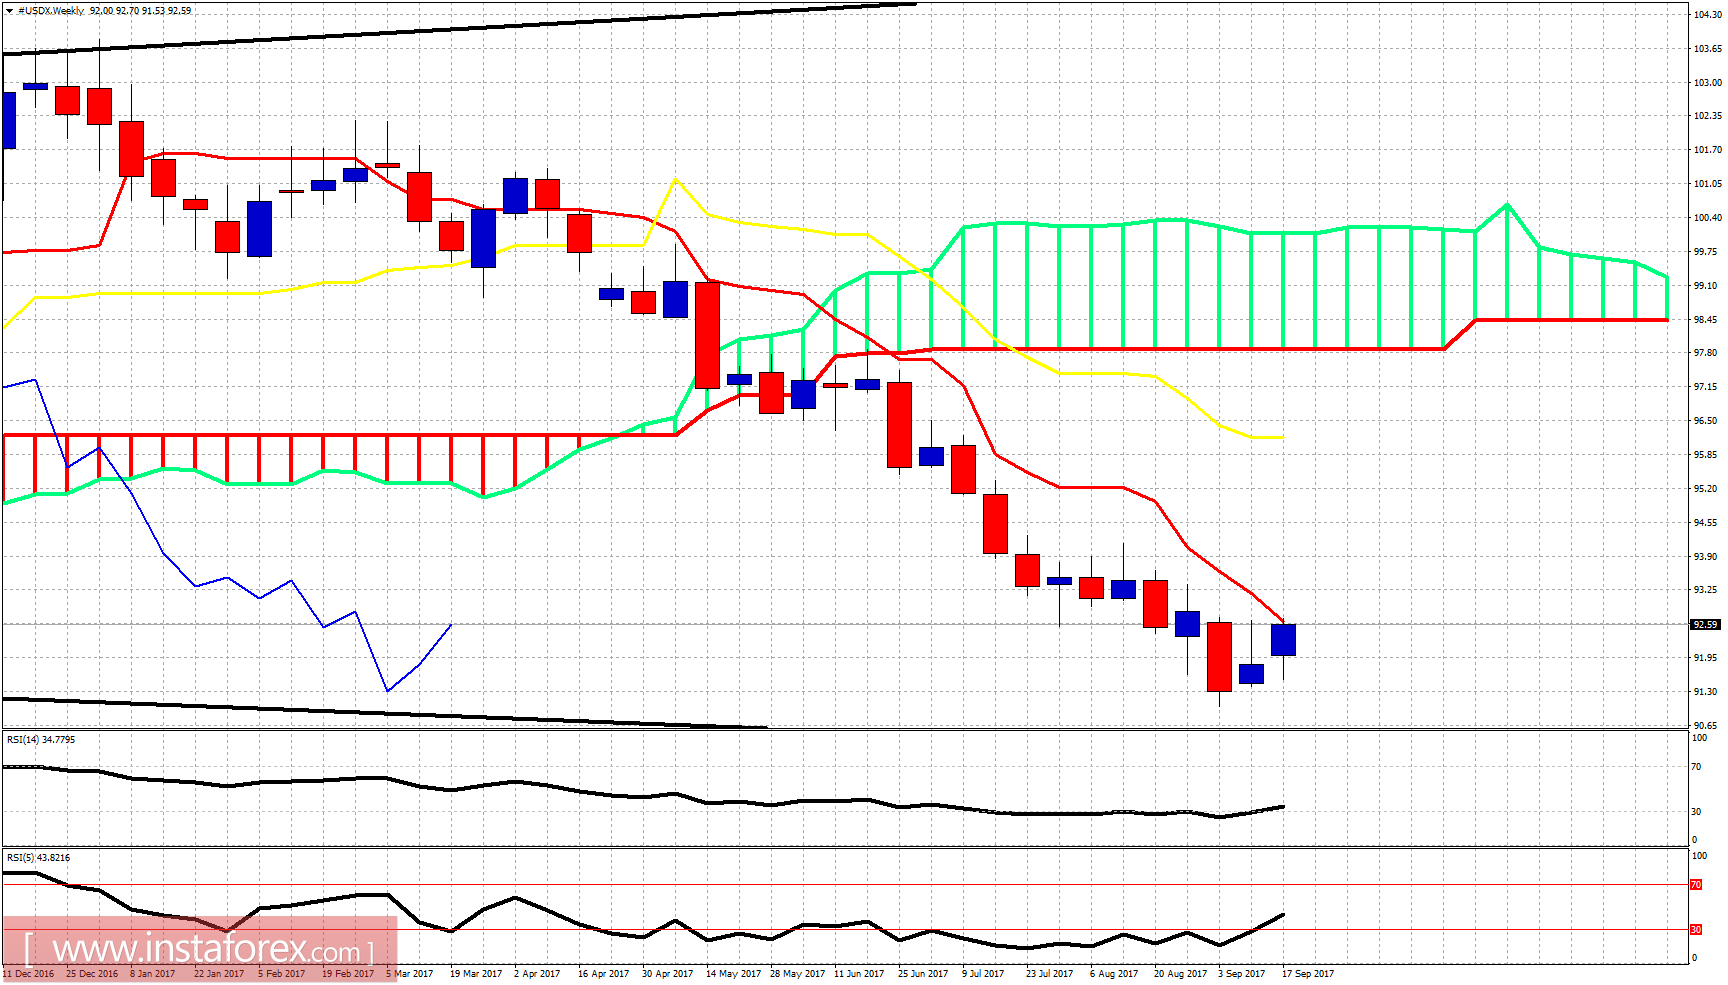
On a weekly basis, the Dollar index is testing the weekly tenkan-sen resistance (red line indicator). Price remains in bearish trend. The rest of this week and the next will be very important for the medium-term move which the index will make. A rejection here will open the way for new lows below 90. Continuation of Dollar strength will open the way for a bigger bounce towards 96.
*The market analysis posted here is meant to increase your awareness, but not to give instructions to make a trade
 English
  Русский
 Bahasa Indonesia
 Bahasa Malay
 ไทย
ไทย Español
 Deutsch
 Български
 Français
 Tiếng Việt
 中文
中文 বাংলা
বাংলা हिन्दी
 Čeština
 Українська
 Română
 Long-term review