 English
  Русский
 Bahasa Indonesia
 Bahasa Malay
 ไทย
ไทย Español
 Deutsch
 Български
 Français
 Tiếng Việt
 中文
中文 বাংলা
বাংলা हिन्दी
 Čeština
 Українська
 Română

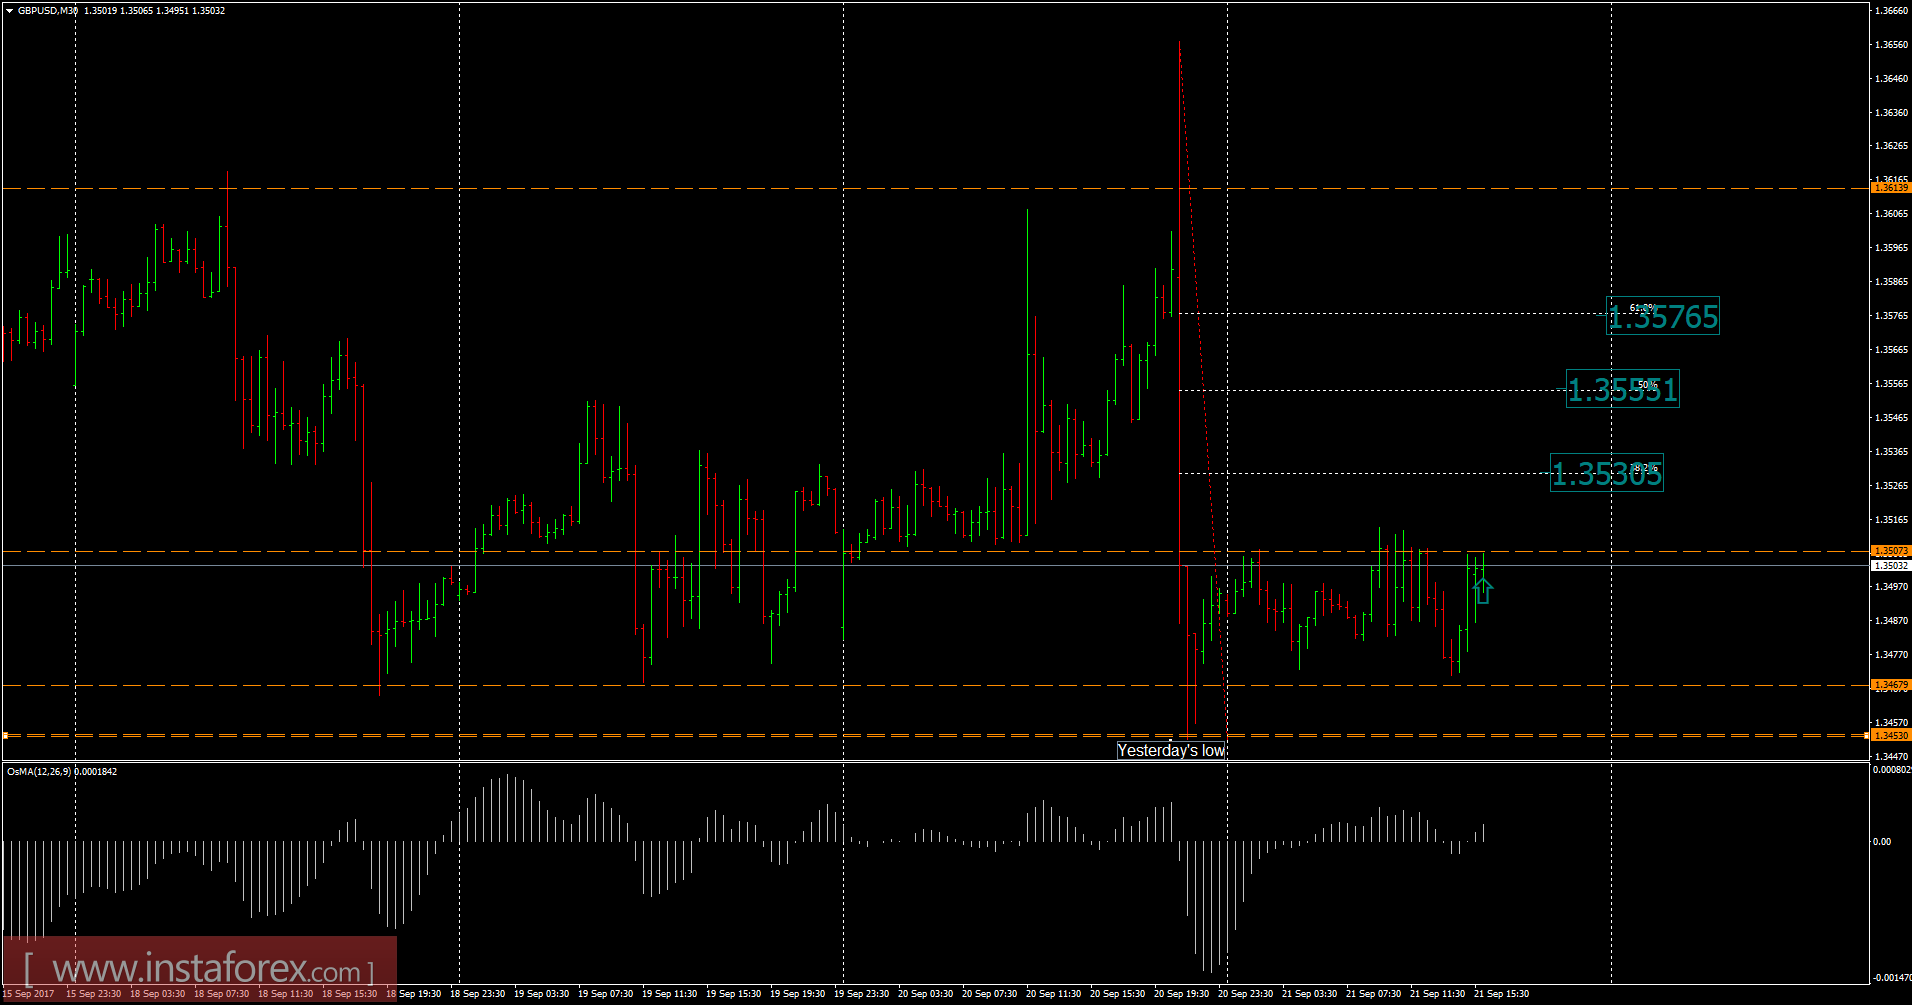
Recently, the GBP/USD pair has been trading downwards. As I expected, the price tested the level of 1.3451 in an ultra high volume. According to the 30M time frame, I found a selling climax in the background and weak selling today, which is a sign that selling looks risky. I found a breakout of the overnight trading range, which is another sign of potential strength. My advice is to watch for potential buying opportunities. The upward targets are set at the price of 1.3530, 1.3555, and 1.3575. All targets are based on Fibonacci work.
Resistance levels:
R1: 1.3512
R2: 1.3530
R3: 1.3545
Support levels:
S1: 1.3480
S2: 1.3465
S3: 1.3450
Trading recommendations for today: watch for potential buying opportunities.