 English
  Русский
 Bahasa Indonesia
 Bahasa Malay
 ไทย
ไทย Español
 Deutsch
 Български
 Français
 Tiếng Việt
 中文
中文 বাংলা
বাংলা हिन्दी
 Čeština
 Українська
 Română

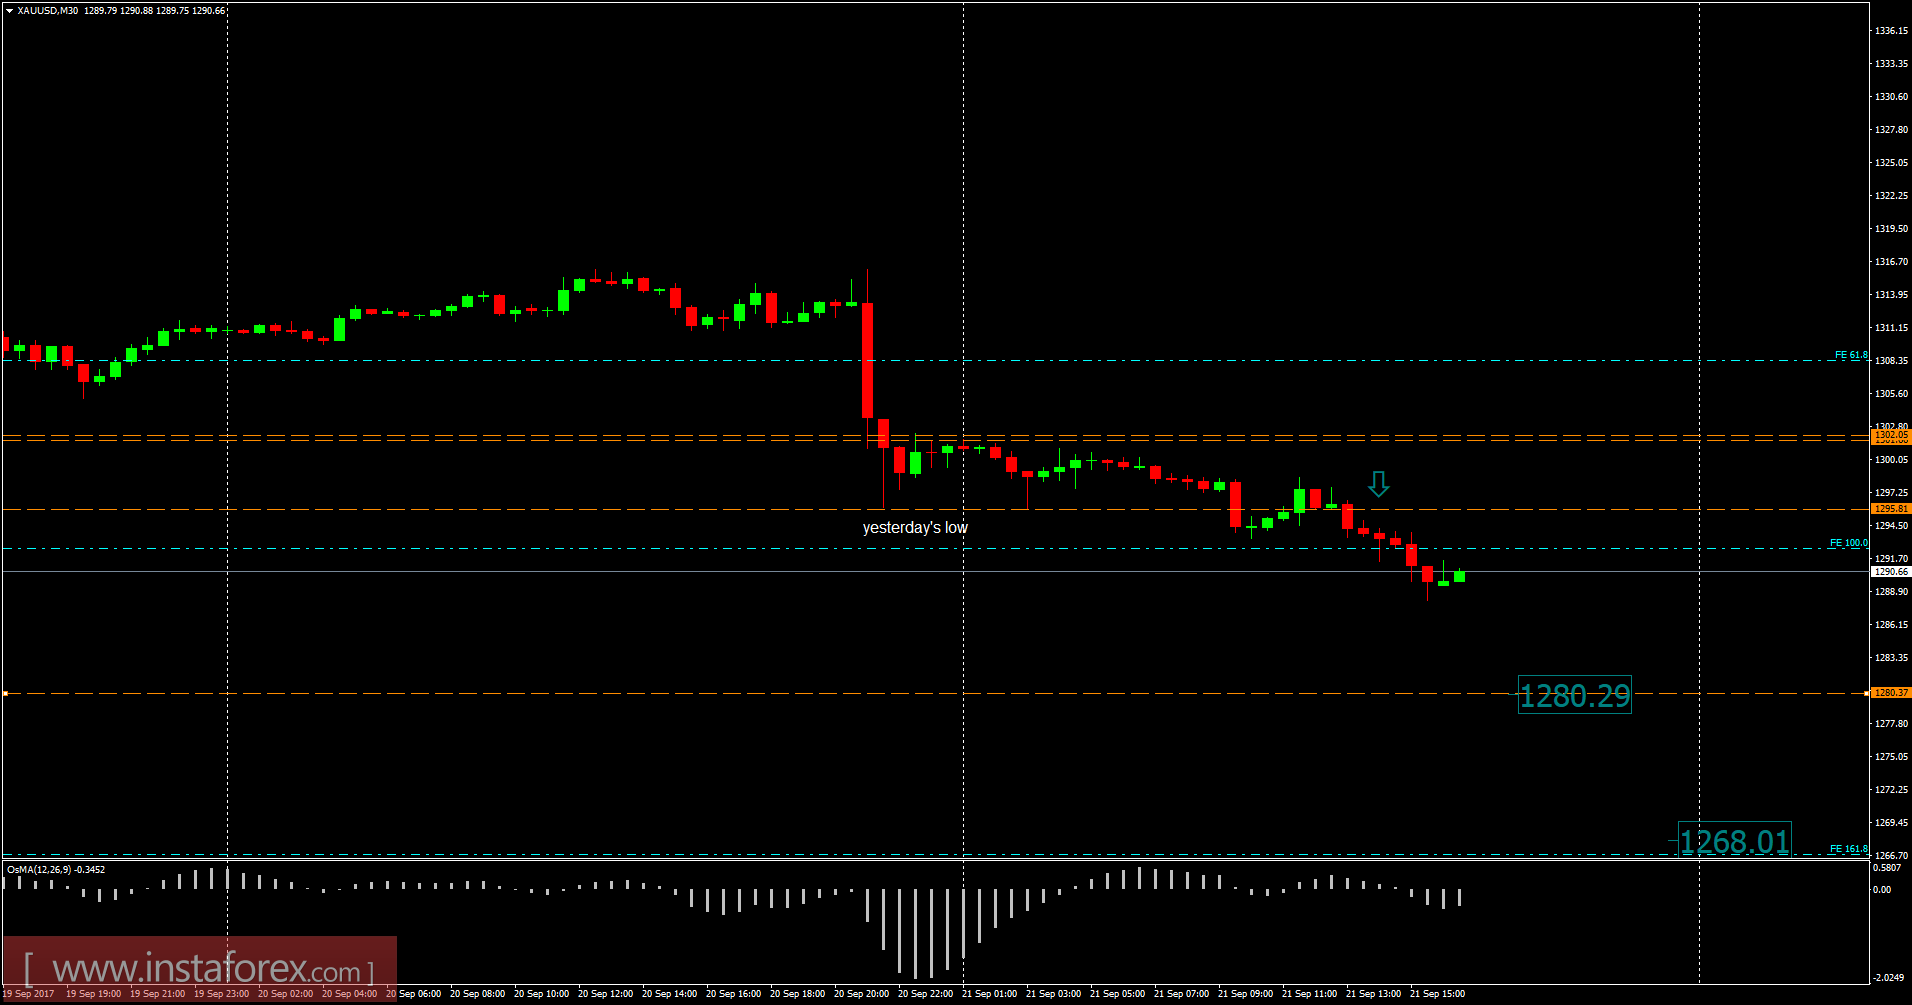
Recently, Gold has been trading downwards. The price tested the level of $1,288.00. According to the 30M time frame, I found that price did break yesterday's low at the level of $1,295.00, which is a sign that sellers are in control. Another sign of weakness is very weak reaction from buyers after a breakout of yesterday's low. My advice is to watch for potential selling opportunities. The downward targets are set at the price of $1,280.00 and $1,268.00.
Resistance levels:
R1: $1,324.00
R2: $1,322.20
R3: $1,344.60
Support levels:
S1: $1,304.00
S2: $1,291.60
S3: $1,283.70
Trading recommendations for today: watch for potential selling opportunities.