 English
  Русский
 Bahasa Indonesia
 Bahasa Malay
 ไทย
ไทย Español
 Deutsch
 Български
 Français
 Tiếng Việt
 中文
中文 বাংলা
বাংলা हिन्दी
 Čeština
 Українська
 Română

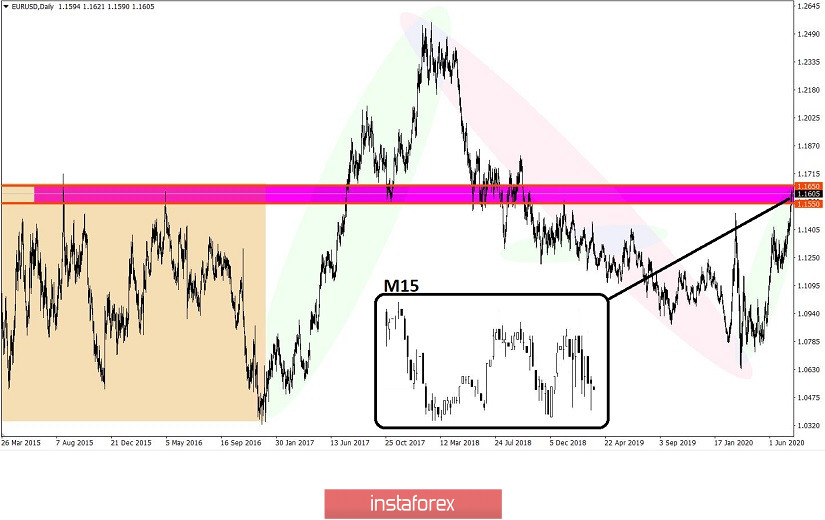
The trading week is coming to an end and it's time for us to summarize the preliminary results. It is not so easy to stop a speculative upward move, all market participants were convinced of this after the quote updated the current year's maximum 1.1496 ---> 1.1626 and automatically hit the region of autumn 2018. More than 400 points since the beginning of July and 830 points since May, this is the scale we are dealing with. he angle of inclination during the inertia course is 70-82 degrees, and now compare it with the rate of price change and you get a clear signal that the European currency is overbought and thus the US dollar is oversold.
A sell signal is nowhere clearer, and if you dive deeper into technical analysis, then the area of 1.1550/1.1650, where the quote is now located, is one of the most important resistance, which puts pressure on market participants. But even this may not be enough if the market has a high emotional mood, which covers all technical and fundamental factors, leaving only speculators' excitement.
Examining the past trading day in detail, we can see two remarkable rounds of speculation. The first one took place from 11:30 to 12:30 UTC+00, where the quote broke through the overnight range of 1.1563/1.1600 and moved towards the value of 1.1500. The second round of speculation took place from 13:00 to 15:30 UTC+00, where the quote rebounded from the level of 1.1550, and, against the backdrop of the emotions of the news background, updated the maximum of 1.1600 ---> 1.1626.
In terms of volatility, an acceleration is still recorded relative to the average daily indicator of 76 ---> 86 points, which indicates that the coefficient of speculative positions is at a high level.
Looking at the trading chart in general terms (daily period), you can see medium-term price trends highlighted with colored ellipses on the trading chart below, but you should also pay attention to the period of 2015 and 2016. The quote had a medium-term sideways trend, where the 1.1550/1.1650 area played the role of resistance and the upper border of the range.
The news background of the past day included data on the labor market in the United States, where weekly claims for unemployment benefits will be published, which shocked American investors. So, for the first time since spring, primary applications for benefits reflected an increase from 1,307,000 to 1,416,000 (+109,000), and with a stable information background about the economic recovery, this is like a shot. Repeated applications for benefits turned out to be better than the forecast, they declined by 1,107,000, which were noticed by traders.
The market's reaction was as follows: at the time of the publication of the data (12:30 Universal time), the dollar rate locally strengthened, probably on the indicators of repeated orders, but after understanding the situation, a reverse price movement occurs, based on which the maximum is updated.
Let me remind you that the historical record for the number of applications for benefits was recorded at the end of March, when 6,648,000 people applied for help.
The coronavirus is still relevant in the world, and it continues to set anti-records in the United States. The other day in the United States passed the mark of +70 thousand daily gain, and the total figure since the beginning of the pandemic has completely exceeded 4 million. With the current trend, the reason for the increase in unemployment in the United States and the increase in new claims for benefits becomes clear.
Today, in terms of the economic calendar, we have preliminary data on the index of business activity in Europe, which came out with a positive background. So the index in the service sector increased from 48.3 to 54.8, while the manufacturing sector increased from 47.4 to 51.1. The composite business activity index, in turn, is growing from 48.5 to 54.8.
That is, all indicators came out better than forecasted, but the European currency continued to stand in one place, drawing Doji candlestick patterns.
A similar PMI will be published in the afternoon, but for the United States, it is also expected to rise.
13:45 Universal time - Business activity index (PMI) in the services sector for July: Pre 47.9 ---> Forecast 51.0
13:45 Universal time - Manufacturing PMI for July: Pre 49.8 ---> Forecast 51.5
Finally, there are data on new home sales in the United States for June (14:00 Universal time), where sales are predicted to grow from 676 thousand to 700 thousand.

The upcoming trading week in terms of the economic calendar, has a package of statistics on the US and Europe, but the key event will be the meeting of the Federal Reserve System.
The most interesting events are displayed below (Universal Time UTC+00) --->
Monday July 27th
USA 12:30 - Orders for durable goods (June)
Wednesday 29 July
USA 18:00 - Results of the meeting of the Federal Open Markets Committee of the FRS
USA 18:30 - Fed press conference
Thursday 30 July
USA 12:30 - GDP (Q2), PRELIMINARY
USA 12:30 - Claims for unemployment benefits
Friday July 31st
EU 9:00 - GDP (Q2), PRELIMINARY
EU 9:00 - Inflation, PRELIMINARY
Further development
Analyzing the current trading chart, we see a low-amplitude price fluctuation within 1.1590/1.1626, which indicates high pressure and an overbought signal in the market. The area of 1.1550/1.1650 will continue to interact with traders' positions, which will be expressed in ambiguous fluctuations, although a sell signal is already clearly visible on the market.
In terms of the emotional component of the market, there is a very high speculative coefficient, which worries most traders.
It can be assumed that if the price consolidates below the level of 1.1590, a surge in short positions will occur, which will return the quote to the area of 1.1550. For the most significant changes in the quote, it is necessary to consolidate below 1.1550 on a four-hour period to get the clearest signal of recovery.
An alternative scenario is considered in the case of price consolidation above 1.1650 on a daily period, which may indicate a change in price trends.
Indicator analysis
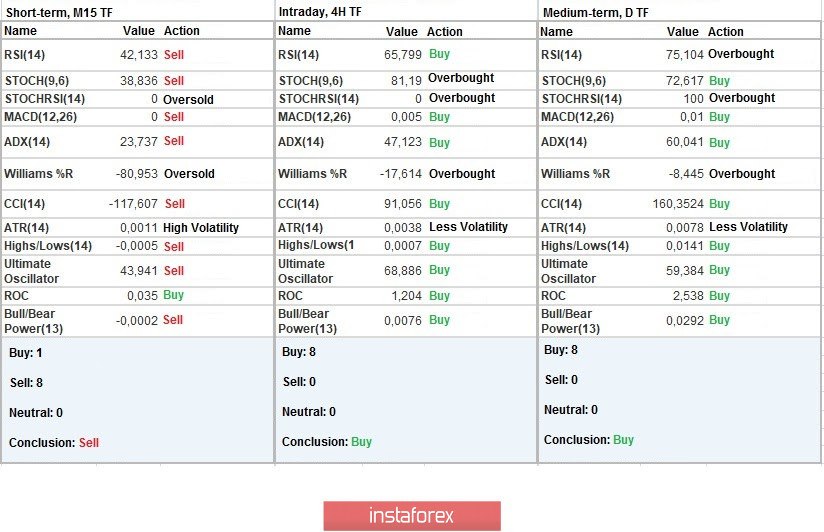
Analyzing different sectors of time frames (TF), we see that the indicators of technical instruments on 1-minute intervals have a buy/sell signal due to the price movement inside the accumulation 1.1590/1.1626. Meanwhile, the hourly and daily time frames continue to signal buy from fluctuations at current year highs.
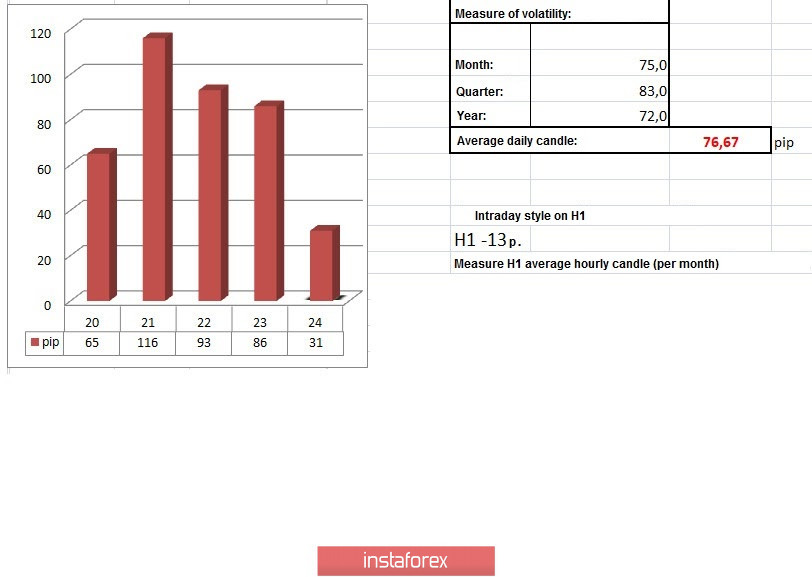
Weekly volatility / Volatility measurement: Month; Quarter; Year
The volatility measurement reflects the average daily fluctuation calculated for the Month / Quarter / Year.
(July 24 was built taking into account the time of publication of the article)
The volatility of the current time is 31 points, which is 59% below the daily average. It can be assumed that the breakdown of the savings boundaries 1.1590/1.1626 will lead to the first round of acceleration.
Key levels
Resistance zones: 1.1650 *; 1.1720 **; 1.1850 **; 1.2100
Support zones: 1.1500 1.1350; 1.1250 *; 1.1.180 **; 1.1080; 1.1000 ***; 1.0850 **; 1.0775 *; 1.0650 (1.0636); 1.0500 ***; 1.0350 **; 1.0000 ***.
* Periodic level
** Range level
*** Psychological level