 English
  Русский
 Bahasa Indonesia
 Bahasa Malay
 ไทย
ไทย Español
 Deutsch
 Български
 Français
 Tiếng Việt
 中文
中文 বাংলা
বাংলা हिन्दी
 Čeština
 Українська
 Română
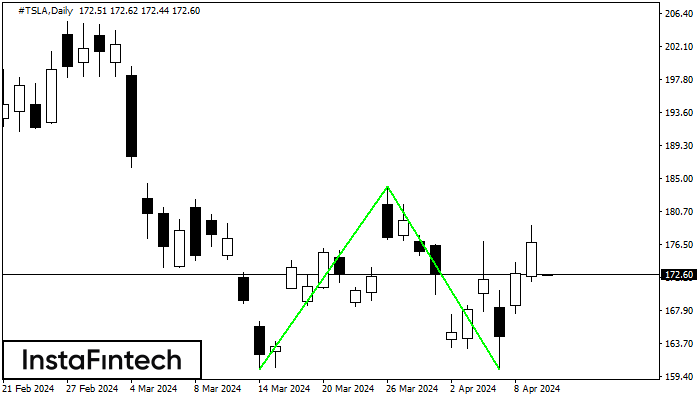 The Double Bottom pattern has been formed on #TSLA D1. Characteristics: the support level 160.28; the resistance level 183.99; the width of the pattern 2371 points. If the resistance level is broken, a change in the trend can be predicted with the first target point lying at the distance of 2369 points.
 FX.co ★ #TSLA D1: Double Bottom
Signal strength 5 of 5
#TSLA D1: Double Bottom
The Double Bottom pattern has been formed on #TSLA D1. Characteristics: the support level 160.28; the resistance level 183.99; the width of the pattern 2371 points. If the resistance level is broken, a change in the trend can be predicted with the first target point lying at the distance of 2369 points. *The market analysis posted here is meant to increase your awareness, but not to give instructions to make a trade