 English
  Русский
 Bahasa Indonesia
 Bahasa Malay
 ไทย
ไทย Español
 Deutsch
 Български
 Français
 Tiếng Việt
 中文
中文 বাংলা
বাংলা हिन्दी
 Čeština
 Українська
 Română
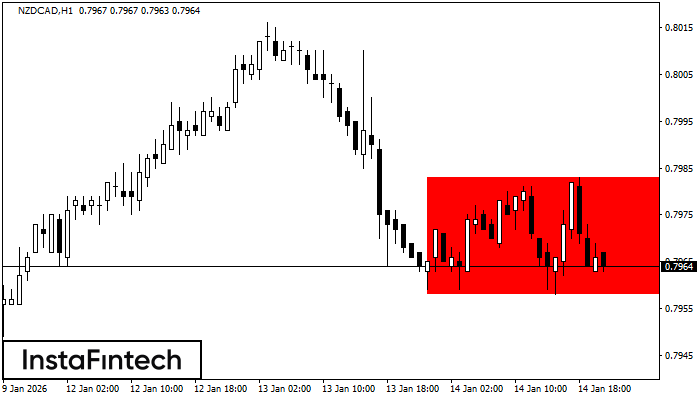 According to the chart of H1, NZDCAD formed the Bearish Rectangle which is a pattern of a trend continuation. The pattern is contained within the following borders: lower border 0.7958 – 0.7958 and upper border 0.7983 – 0.7983. In case the lower border is broken, the instrument is likely to follow the downward trend.
 FX.co ★ NZDCAD H1: Bearish Rectangle
Signal strength 4 of 5
NZDCAD H1: Bearish Rectangle
According to the chart of H1, NZDCAD formed the Bearish Rectangle which is a pattern of a trend continuation. The pattern is contained within the following borders: lower border 0.7958 – 0.7958 and upper border 0.7983 – 0.7983. In case the lower border is broken, the instrument is likely to follow the downward trend. *The market analysis posted here is meant to increase your awareness, but not to give instructions to make a trade