 English
 Русский
 Bahasa Indonesia
 Bahasa Malay
 ไทย
ไทย Español
 Deutsch
 Български
 Français
 Tiếng Việt
 中文
中文 বাংলা
বাংলা हिन्दी
 Čeština
 Українська
 Română

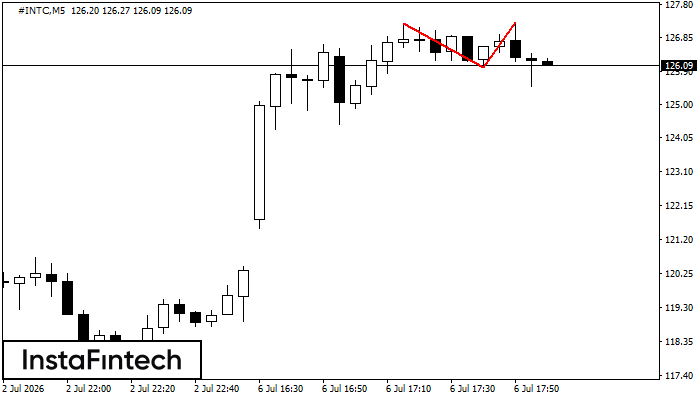 On the chart of #INTC M5 the Double Top reversal pattern has been formed. Characteristics: the upper boundary 127.29; the lower boundary 126.02; the width of the pattern 127 points. The signal: a break of the lower boundary will cause continuation of the downward trend targeting the 125.87 level.
 The M5 and M15 time frames may have more false entry points.