 English
 Русский
 Bahasa Indonesia
 Bahasa Malay
 ไทย
ไทย Español
 Deutsch
 Български
 Français
 Tiếng Việt
 中文
中文 বাংলা
বাংলা हिन्दी
 Čeština
 Українська
 Română

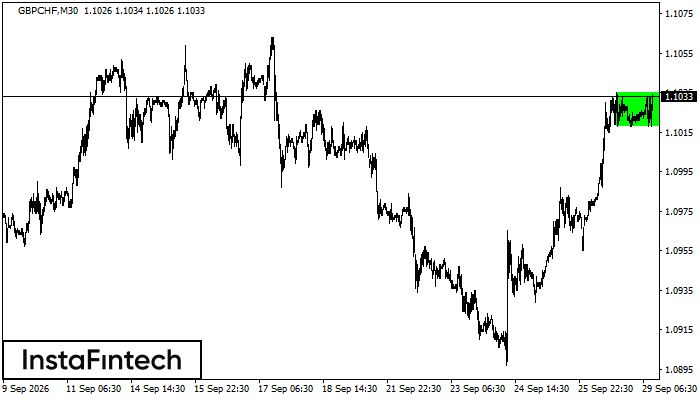 The Bullish Rectangle has formed on the GBPCHF M30 chart. This pattern indicates a likely continuation of the trend. Its resistance is at 1.1035 and its support is at 1.1018. A breakout above the resistance zone at 1.1035–1.1035 is likely to signal a continuation of the bullish trend.
 FX.co ★ GBPCHF M30: Bullish Rectangle
Signal strength 3 of 5
GBPCHF M30: Bullish Rectangle
The Bullish Rectangle has formed on the GBPCHF M30 chart. This pattern indicates a likely continuation of the trend. Its resistance is at 1.1035 and its support is at 1.1018. A breakout above the resistance zone at 1.1035–1.1035 is likely to signal a continuation of the bullish trend. *The market analysis posted here is meant to increase your awareness, but not to give instructions to make a trade