 English

 Русский
 Bahasa Indonesia
 Bahasa Malay
 ไทย
 Español
 Deutsch
 Български
 Français
 Tiếng Việt
 中文
 বাংলা
 हिन्दी
 Čeština
 Українська
 Română


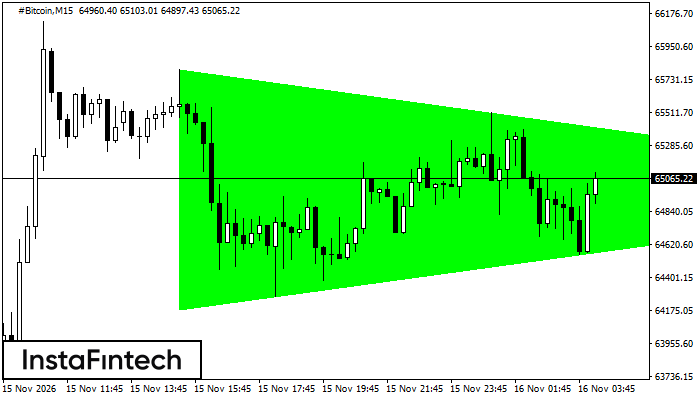 The Bullish Symmetrical Triangle pattern has formed on the #Bitcoin M15 chart, signaling a likely continuation of the trend. Its upper boundary passes through 65801.54/64984.59, while its lower boundary passes through 64185.54/64984.59. The pattern width is 161600 points. When the Bullish Symmetrical Triangle forms during an uptrend, it indicates that the prevailing trend may continue. A breakout above 64984.59 could send the price toward 64984.82.
The M5 and M15 time frames may generate more false entry signals.