 English
  Русский
 Bahasa Indonesia
 Bahasa Malay
 ไทย
ไทย Español
 Deutsch
 Български
 Français
 Tiếng Việt
 中文
中文 বাংলা
বাংলা हिन्दी
 Čeština
 Українська
 Română
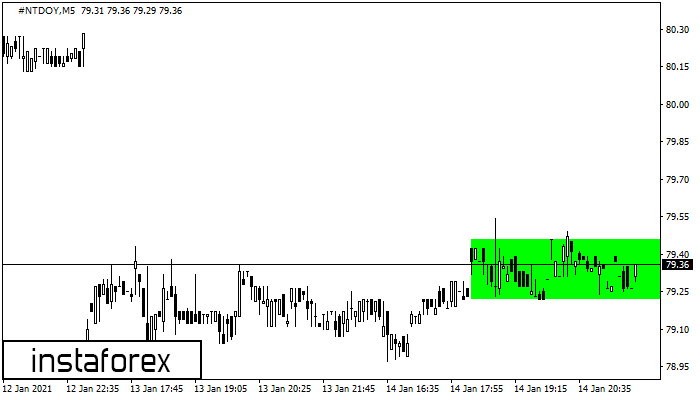 According to the chart of M5, #NTDOY formed the Bullish Rectangle which is a pattern of a trend continuation. The pattern is contained within the following borders: the lower border 79.22 – 79.22 and upper border 79.46 – 79.46. In case the upper border is broken, the instrument is likely to follow the upward trend.
 The M5 and M15 time frames may have more false entry points.