 English
  Русский
 Bahasa Indonesia
 Bahasa Malay
 ไทย
ไทย Español
 Deutsch
 Български
 Français
 Tiếng Việt
 中文
中文 বাংলা
বাংলা हिन्दी
 Čeština
 Українська
 Română
 According to the chart of M5, #TSLA formed the Bearish Symmetrical Triangle pattern. Trading recommendations: A breach of the lower border 184.09 is likely to encourage a continuation of the downward trend.
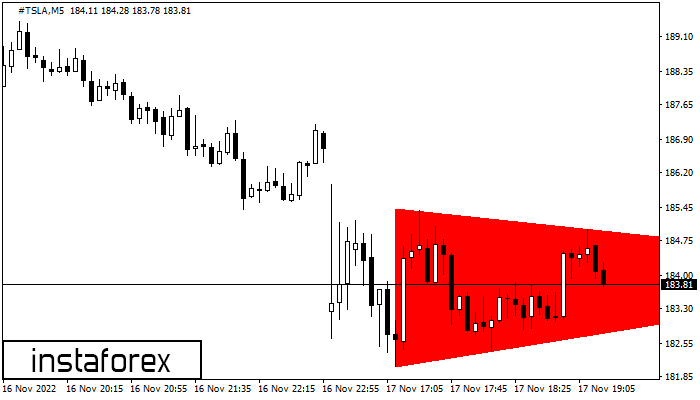
 The M5 and M15 time frames may have more false entry points.