 English
  Русский
 Bahasa Indonesia
 Bahasa Malay
 ไทย
ไทย Español
 Deutsch
 Български
 Français
 Tiếng Việt
 中文
中文 বাংলা
বাংলা हिन्दी
 Čeština
 Українська
 Română
FX.co ★ Actual patterns. Technical analysis and trading recommendations

Technical Analysis Patterns
There is nothing more precious to a trader than an ability to predict a further price movement. Technical analysis is a key to your successful transaction. At the same time, you can rely on common and recurring situations that arise in the same circumstances. Our Technical Analysis Patterns section features all trading recommendations based on the technical analysis patterns that help traders make projections and turn a profit.
Instrument:
1 selected
#Bitcoin
EURCHF
EURGBP
EURJPY
EURUSD
EURCAD
EURRUB
EURNZD
USDCAD
USDCHF
USDJPY
USDRUB
NZDCAD
NZDUSD
NZDCHF
NZDJPY
AUDCAD
AUDCHF
AUDJPY
AUDUSD
GBPUSD
GBPJPY
GBPAUD
GBPCHF
GOLD
SILVER
#AAPL
#AMZN
#EBAY
#FB
#GOOG
#MCD
#MA
#KO
#INTC
#MSFT
#NTDOY
#PEP
#TSLA
#TWTR
Figure:
All
Triangle
Rectangle
Pennant
Flag
Head and Shoulders
Double Top
Triple top
Timeframe:
All
M5
M15
M30
H1
D1
Signal strength:
All
High
Medium
Low
Signal direction:
All
Buy
Sell
GOLD
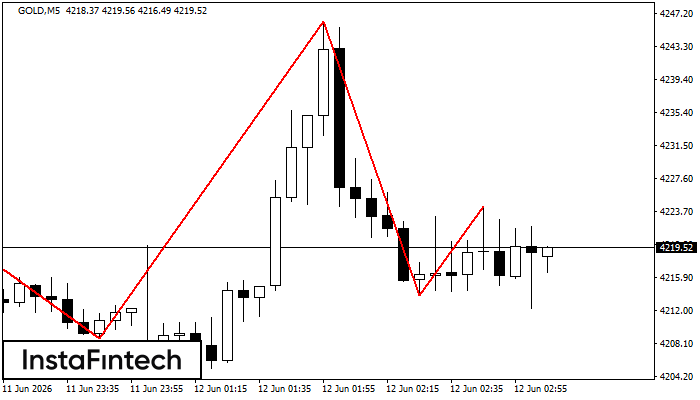
GOLD M5
Head and Shoulders
The technical pattern called Head and Shoulders has appeared on the chart of GOLD M5. There are weighty reasons to suggest that the price will surpass the Neckline 4208.68/4213.84 after the right shoulder has been formed. So, the trend is set to change with the price heading for 4213.69.
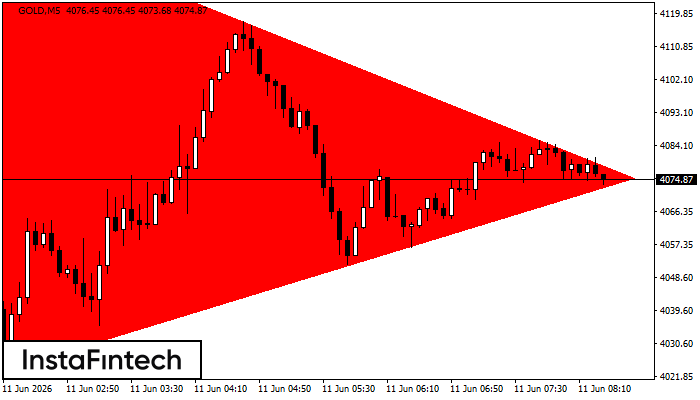
GOLD M5
Bearish Symmetrical Triangle
According to the chart of M5, GOLD formed the Bearish Symmetrical Triangle pattern. Description: The lower border is 4023.48/4075.39 and upper border is 4143.72/4075.39. The pattern width is measured on the chart at -12024 pips. The formation of the Bearish Symmetrical Triangle pattern evidently signals a continuation of the downward trend. In other words, if the scenario comes true and GOLD breaches the lower border, the price could continue its move toward 4075.24.
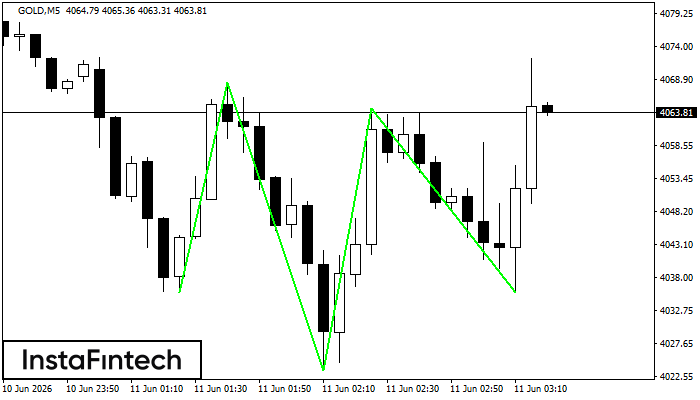
GOLD M5
Inverse Head and Shoulder
According to M5, GOLD is shaping the technical pattern – the Inverse Head and Shoulder. In case the Neckline 4068.47/4064.37 is broken out, the instrument is likely to move toward 4064.52.
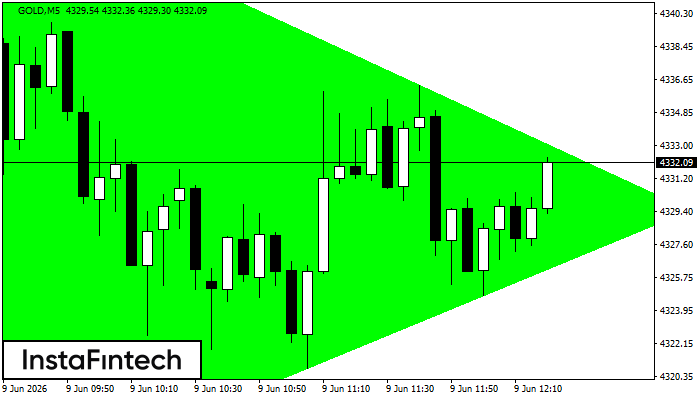
GOLD M5
Bullish Symmetrical Triangle
According to the chart of M5, GOLD formed the Bullish Symmetrical Triangle pattern. The lower border of the pattern touches the coordinates 4310.25/4329.45 whereas the upper border goes across 4350.97/4329.45. If the Bullish Symmetrical Triangle pattern is in progress, this evidently signals a further upward trend. In other words, in case the scenario comes true, the price of GOLD will breach the upper border to head for 4329.60.
GOLD M5
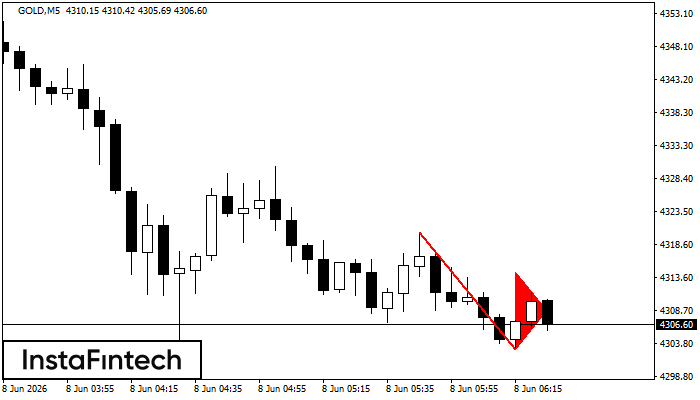
Bearish Flag
The Bearish Flag pattern has been formed on the chart GOLD M5. Therefore, the downwards trend is likely to continue in the nearest term. As soon as the price breaks below the low at 4302.92, traders should enter the market.
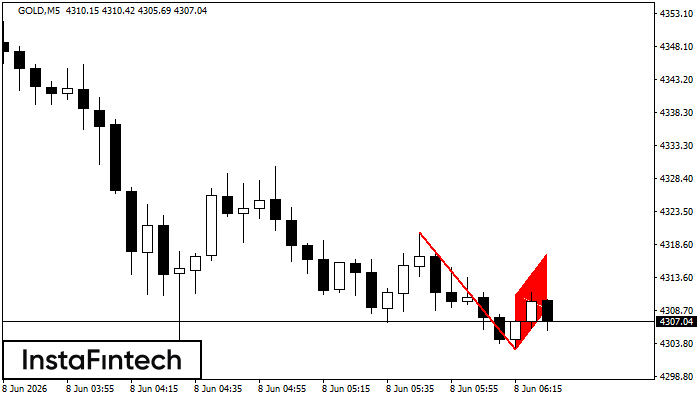
GOLD M5
Bearish pennant
The Bearish pennant pattern has formed on the GOLD M5 chart. The pattern signals continuation of the downtrend in case the pennant’s low of 4302.92 is broken through. Recommendations: Place the sell stop pending order 10 pips below the pattern’s low. Place the take profit order at the projection distance of the flagpole height.
GOLD M5
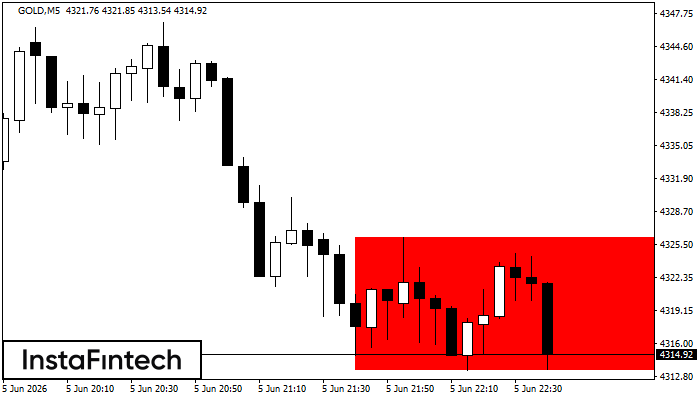
Bearish Rectangle
According to the chart of M5, GOLD formed the Bearish Rectangle which is a pattern of a trend continuation. The pattern is contained within the following borders: lower border 4313.45 – 4313.45 and upper border 4326.25 – 4326.25. In case the lower border is broken, the instrument is likely to follow the downward trend.
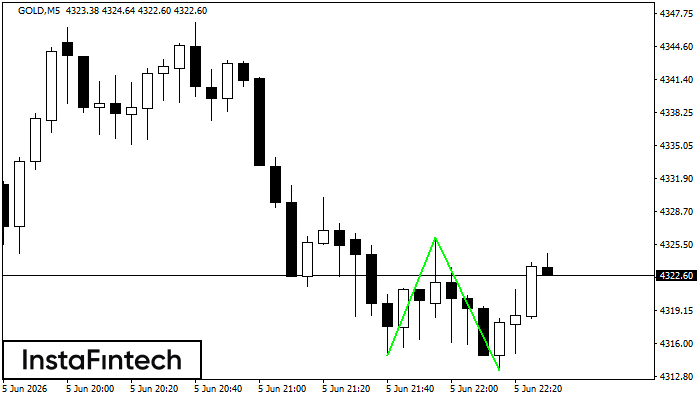
GOLD M5
Double Bottom
The Double Bottom pattern has been formed on GOLD M5. Characteristics: the support level 4314.86; the resistance level 4326.25; the width of the pattern 1139 points. If the resistance level is broken, a change in the trend can be predicted with the first target point lying at the distance of 1280 points.
GOLD M5
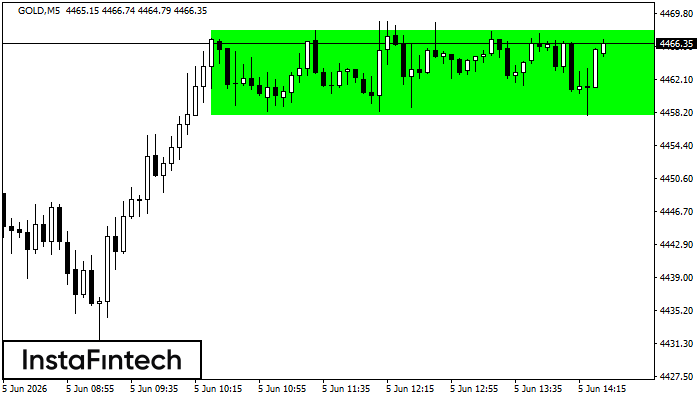
Bullish Rectangle
According to the chart of M5, GOLD formed the Bullish Rectangle. The pattern indicates a trend continuation. The upper border is 4467.77, the lower border is 4457.96. The signal means that a long position should be opened above the upper border 4467.77 of the Bullish Rectangle.
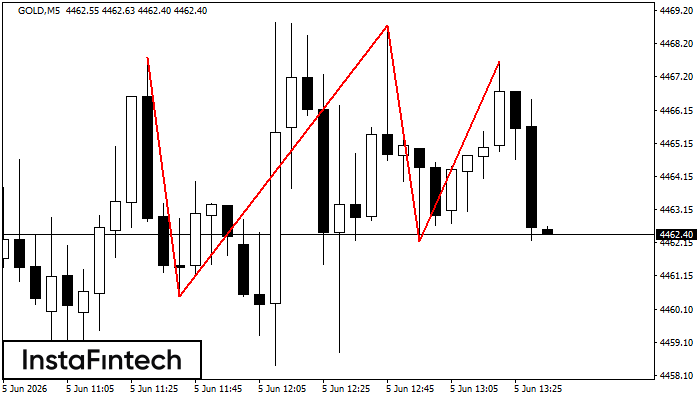
GOLD M5
Triple Top
On the chart of the GOLD M5 trading instrument, the Triple Top pattern that signals a trend change has formed. It is possible that after formation of the third peak, the price will try to break through the resistance level 4460.51, where we advise to open a trading position for sale. Take profit is the projection of the pattern’s width, which is 726 points.