 English
  Русский
 Bahasa Indonesia
 Bahasa Malay
 ไทย
ไทย Español
 Deutsch
 Български
 Français
 Tiếng Việt
 中文
中文 বাংলা
বাংলা हिन्दी
 Čeština
 Українська
 Română
FX.co ★ Actual patterns. Technical analysis and trading recommendations

Technical Analysis Patterns
There is nothing more precious to a trader than an ability to predict a further price movement. Technical analysis is a key to your successful transaction. At the same time, you can rely on common and recurring situations that arise in the same circumstances. Our Technical Analysis Patterns section features all trading recommendations based on the technical analysis patterns that help traders make projections and turn a profit.
Instrument:
1 selected
#Bitcoin
EURCHF
EURGBP
EURJPY
EURUSD
EURCAD
EURRUB
EURNZD
USDCAD
USDCHF
USDJPY
USDRUB
NZDCAD
NZDUSD
NZDCHF
NZDJPY
AUDCAD
AUDCHF
AUDJPY
AUDUSD
GBPUSD
GBPJPY
GBPAUD
GBPCHF
GOLD
SILVER
#AAPL
#AMZN
#EBAY
#FB
#GOOG
#MCD
#MA
#KO
#INTC
#MSFT
#NTDOY
#PEP
#TSLA
#TWTR
Figure:
All
Triangle
Rectangle
Pennant
Flag
Head and Shoulders
Double Top
Triple top
Timeframe:
All
M5
M15
M30
H1
D1
Signal strength:
All
High
Medium
Low
Signal direction:
All
Buy
Sell
#AMZN
#AMZN M5
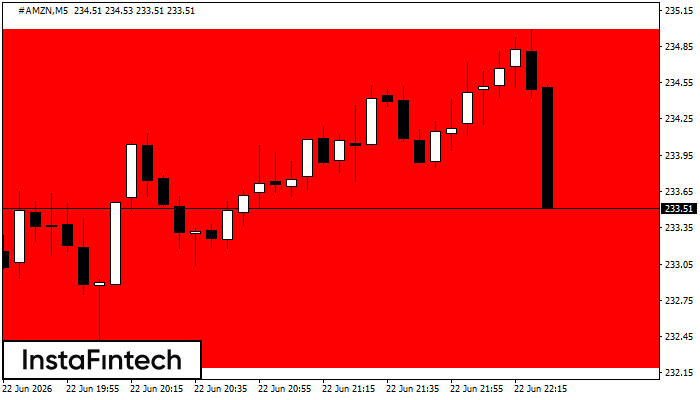
Bearish Rectangle
According to the chart of M5, #AMZN formed the Bearish Rectangle. The pattern indicates a trend continuation. The upper border is 234.99, the lower border is 232.19. The signal means that a short position should be opened after fixing a price below the lower border 232.19 of the Bearish Rectangle.
#AMZN M5
Triple Bottom
The Triple Bottom pattern has formed on the chart of #AMZN M5. Features of the pattern: The lower line of the pattern has coordinates 234.81 with the upper limit 234.81/233.65, the projection of the width is 231 points. The formation of the Triple Bottom pattern most likely indicates a change in the trend from downward to upward. This means that in the event of a breakdown of the resistance level 232.50, the price is most likely to continue the upward movement.
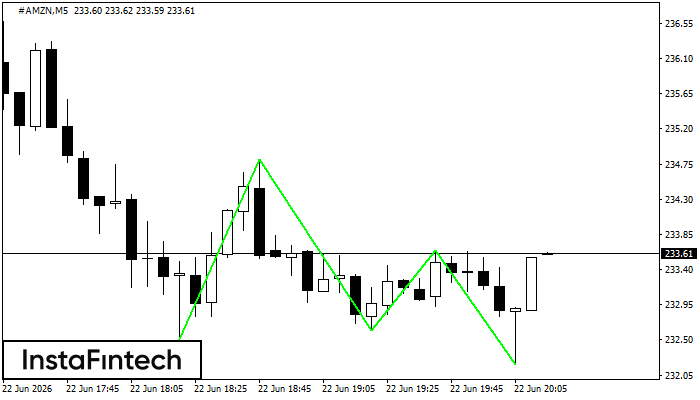
#AMZN M5
Double Bottom
The Double Bottom pattern has been formed on #AMZN M5. Characteristics: the support level 232.50; the resistance level 234.81; the width of the pattern 231 points. If the resistance level is broken, a change in the trend can be predicted with the first target point lying at the distance of 219 points.
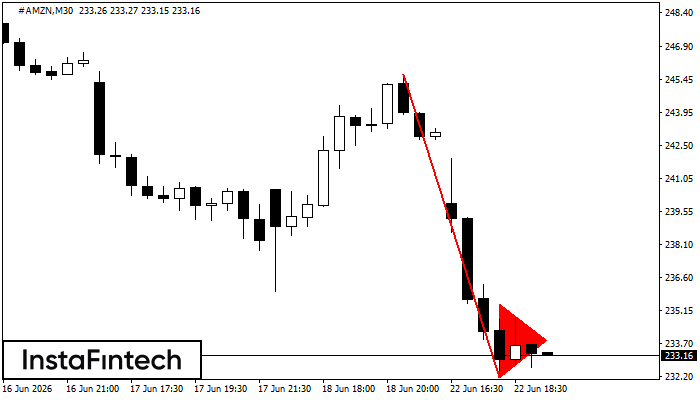
#AMZN M30
Bearish pennant
The Bearish pennant pattern has formed on the #AMZN M30 chart. It signals potential continuation of the existing trend. Specifications: the pattern’s bottom has the coordinate of 232.16; the projection of the flagpole height is equal to 1351 pips. In case the price breaks out the pattern’s bottom of 232.16, the downtrend is expected to continue for further level 231.86.
#AMZN M5
Double Bottom
The Double Bottom pattern has been formed on #AMZN M5. This formation signals a reversal of the trend from downwards to upwards. The signal is that a buy trade should be opened after the upper boundary of the pattern 249.43 is broken. The further movements will rely on the width of the current pattern 402 points.
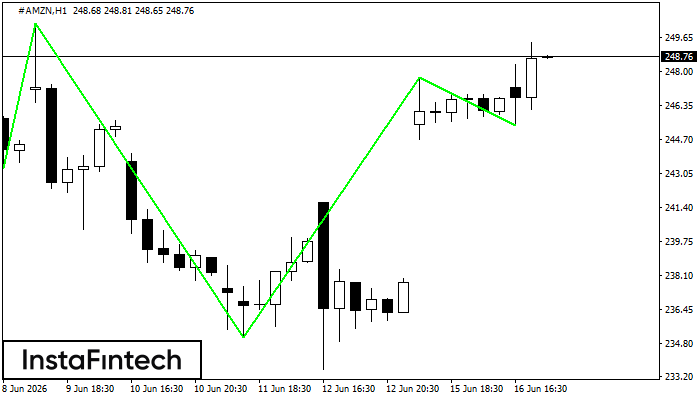
#AMZN H1
Inverse Head and Shoulder
According to H1, #AMZN is shaping the technical pattern – the Inverse Head and Shoulder. In case the Neckline 250.37/247.72 is broken out, the instrument is likely to move toward 248.12.
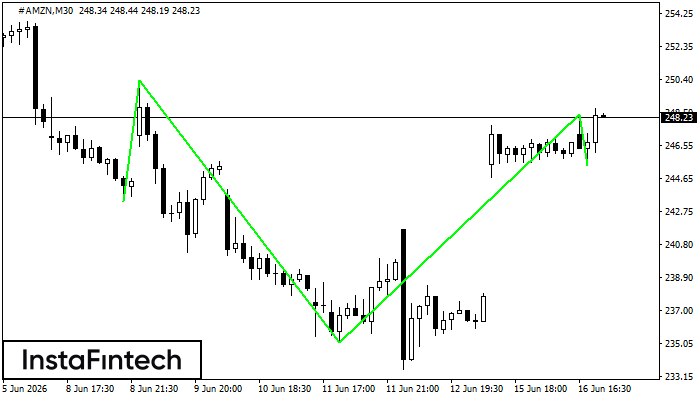
#AMZN M30
Inverse Head and Shoulder
According to M30, #AMZN is shaping the technical pattern – the Inverse Head and Shoulder. In case the Neckline 250.37/248.35 is broken out, the instrument is likely to move toward 248.65.
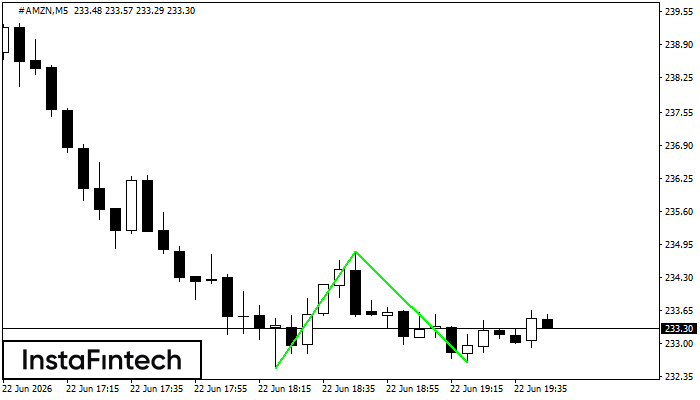
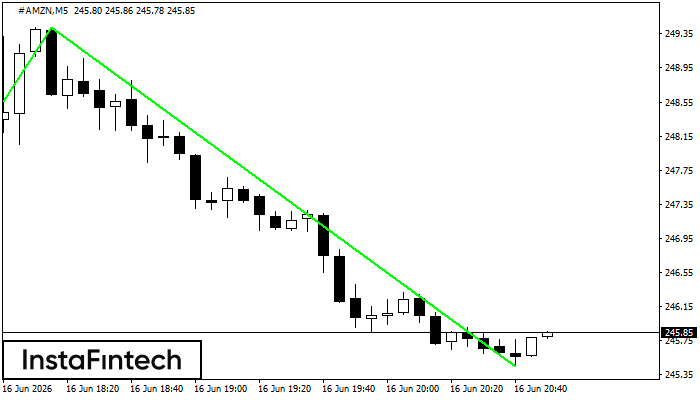
#AMZN M5
Double Top
The Double Top pattern has been formed on #AMZN M5. It signals that the trend has been changed from upwards to downwards. Probably, if the base of the pattern 245.58 is broken, the downward movement will continue.
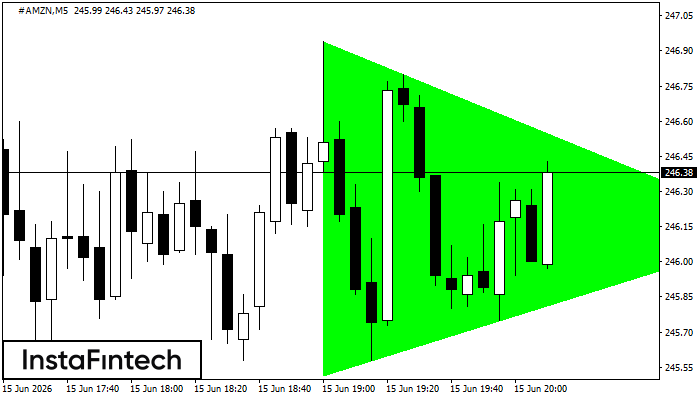
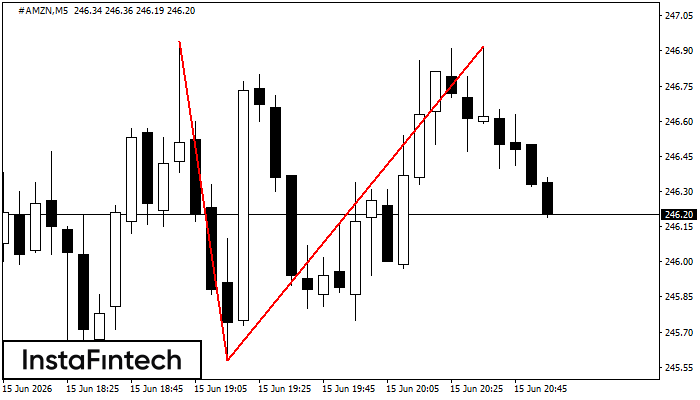
#AMZN M5
Bullish Symmetrical Triangle
According to the chart of M5, #AMZN formed the Bullish Symmetrical Triangle pattern, which signals the trend will continue. Description. The upper border of the pattern touches the coordinates 246.94/246.13 whereas the lower border goes across 245.52/246.13. The pattern width is measured on the chart at 142 pips. If the Bullish Symmetrical Triangle pattern is in progress during the upward trend, this indicates the current trend will go on. In case 246.13 is broken, the price could continue its move toward 246.28.
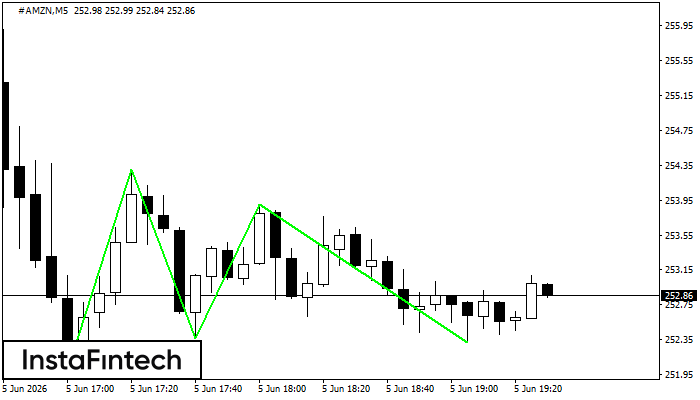
#AMZN M5
Triple Bottom
The Triple Bottom pattern has formed on the chart of #AMZN M5. Features of the pattern: The lower line of the pattern has coordinates 254.30 with the upper limit 254.30/253.90, the projection of the width is 230 points. The formation of the Triple Bottom pattern most likely indicates a change in the trend from downward to upward. This means that in the event of a breakdown of the resistance level 252.00, the price is most likely to continue the upward movement.