 English
  Русский
 Bahasa Indonesia
 Bahasa Malay
 ไทย
ไทย Español
 Deutsch
 Български
 Français
 Tiếng Việt
 中文
中文 বাংলা
বাংলা हिन्दी
 Čeština
 Українська
 Română
FX.co ★ Actual patterns. Technical analysis and trading recommendations

Technical Analysis Patterns
There is nothing more precious to a trader than an ability to predict a further price movement. Technical analysis is a key to your successful transaction. At the same time, you can rely on common and recurring situations that arise in the same circumstances. Our Technical Analysis Patterns section features all trading recommendations based on the technical analysis patterns that help traders make projections and turn a profit.
Instrument:
1 selected
#Bitcoin
EURCHF
EURGBP
EURJPY
EURUSD
EURCAD
EURRUB
EURNZD
USDCAD
USDCHF
USDJPY
USDRUB
NZDCAD
NZDUSD
NZDCHF
NZDJPY
AUDCAD
AUDCHF
AUDJPY
AUDUSD
GBPUSD
GBPJPY
GBPAUD
GBPCHF
GOLD
SILVER
#AAPL
#AMZN
#EBAY
#FB
#GOOG
#MCD
#MA
#KO
#INTC
#MSFT
#NTDOY
#PEP
#TSLA
#TWTR
Figure:
All
Triangle
Rectangle
Pennant
Flag
Head and Shoulders
Double Top
Triple top
Timeframe:
All
M5
M15
M30
H1
D1
Signal strength:
All
High
Medium
Low
Signal direction:
All
Buy
Sell
EURCAD
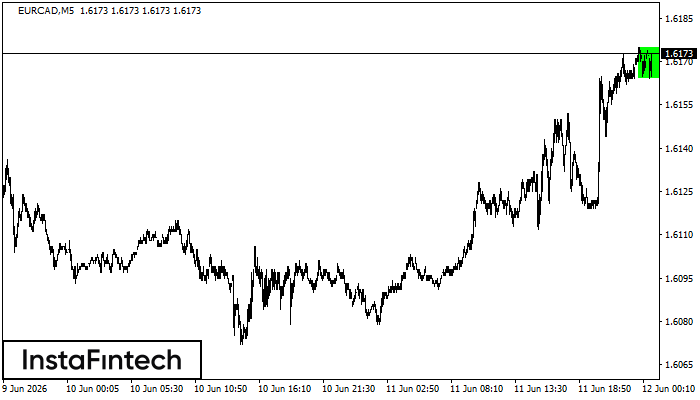
EURCAD M5
Bullish Rectangle
According to the chart of M5, EURCAD formed the Bullish Rectangle which is a pattern of a trend continuation. The pattern is contained within the following borders: the lower border 1.6164 – 1.6164 and upper border 1.6175 – 1.6175. In case the upper border is broken, the instrument is likely to follow the upward trend.
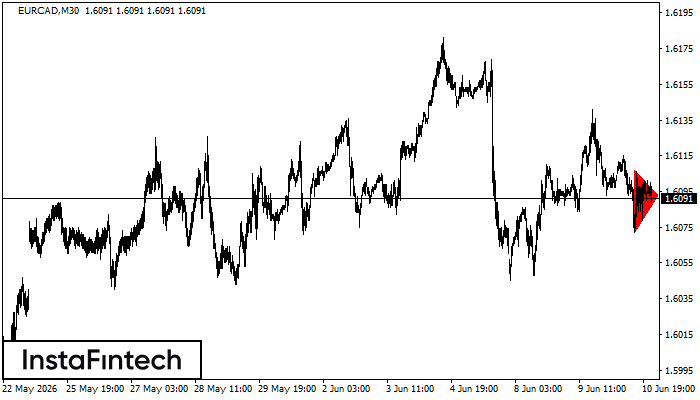
EURCAD M30
Bearish Symmetrical Triangle
According to the chart of M30, EURCAD formed the Bearish Symmetrical Triangle pattern. This pattern signals a further downward trend in case the lower border 1.6072 is breached. Here, a hypothetical profit will equal the width of the available pattern that is -35 pips.
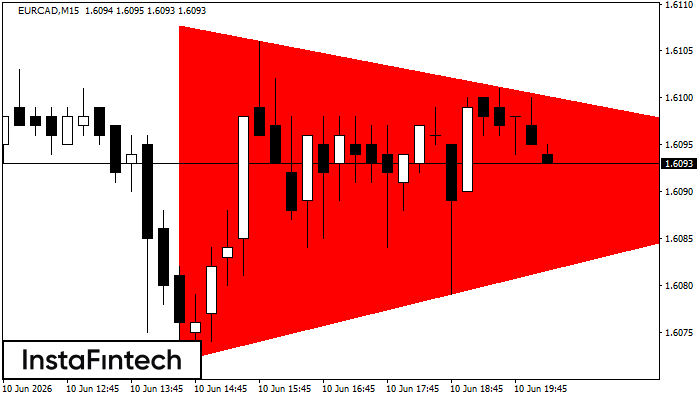
EURCAD M15
Bearish Symmetrical Triangle
According to the chart of M15, EURCAD formed the Bearish Symmetrical Triangle pattern. Description: The lower border is 1.6072/1.6092 and upper border is 1.6108/1.6092. The pattern width is measured on the chart at -36 pips. The formation of the Bearish Symmetrical Triangle pattern evidently signals a continuation of the downward trend. In other words, if the scenario comes true and EURCAD breaches the lower border, the price could continue its move toward 1.6070.
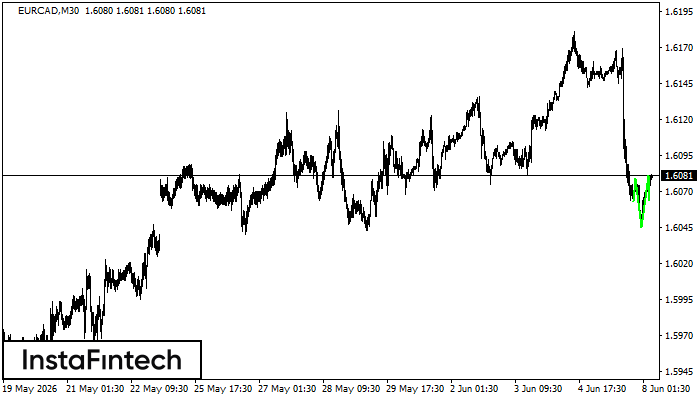
EURCAD M30
Inverse Head and Shoulder
According to M30, EURCAD is shaping the technical pattern – the Inverse Head and Shoulder. In case the Neckline 1.6079/1.6081 is broken out, the instrument is likely to move toward 1.6111.
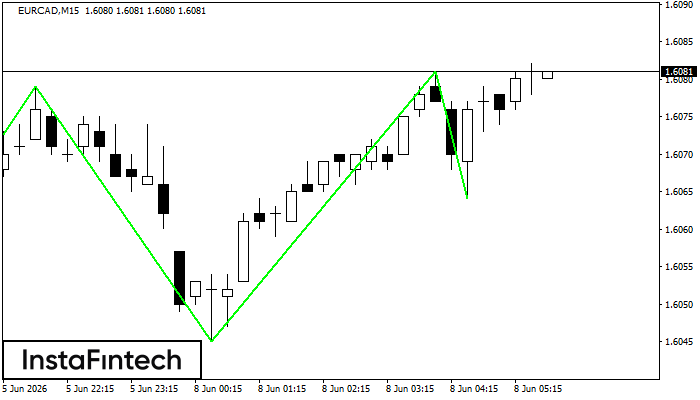
EURCAD M15
Inverse Head and Shoulder
According to the chart of M15, EURCAD produced the pattern termed the Inverse Head and Shoulder. The Head is fixed at 1.6045 while the median line of the Neck is set at 1.6079/1.6081. The formation of the Inverse Head and Shoulder Pattern clearly indicates a reversal of the downward trend. In means that in case the scenario comes true, the price of EURCAD will go towards 1.6104.
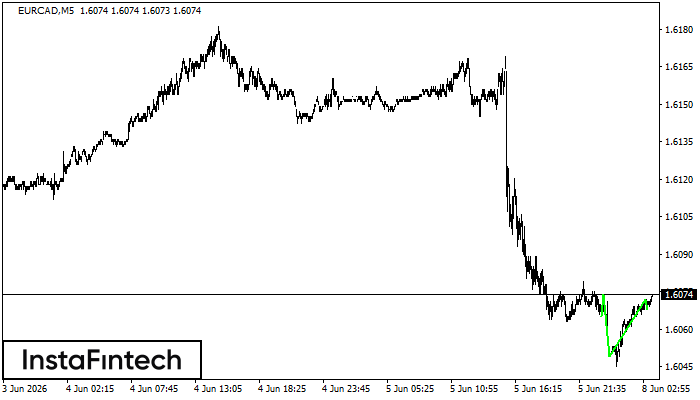
EURCAD M5
Inverse Head and Shoulder
According to the chart of M5, EURCAD formed the Inverse Head and Shoulder pattern. The Head’s top is set at 1.6072 while the median line of the Neck is found at 1.6049/1.6068. The formation of the Inverse Head and Shoulder pattern evidently signals a reversal of the downward trend. In other words, in case the scenario comes true, the price of EURCAD will go towards 1.6087
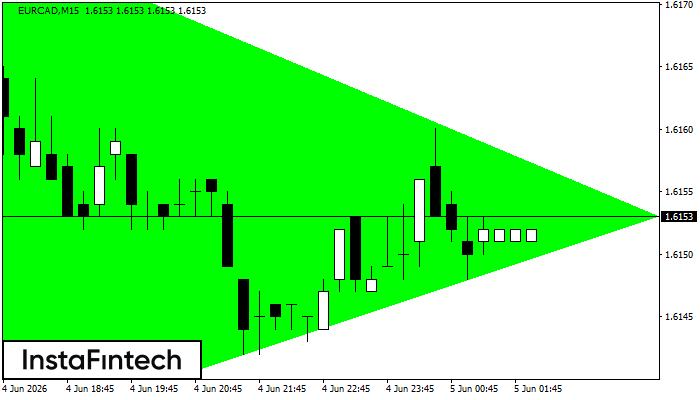
EURCAD M15
Bullish Symmetrical Triangle
According to the chart of M15, EURCAD formed the Bullish Symmetrical Triangle pattern. Description: This is the pattern of a trend continuation. 1.6181 and 1.6131 are the coordinates of the upper and lower borders respectively. The pattern width is measured on the chart at 50 pips. Outlook: If the upper border 1.6181 is broken, the price is likely to continue its move by 1.6176.
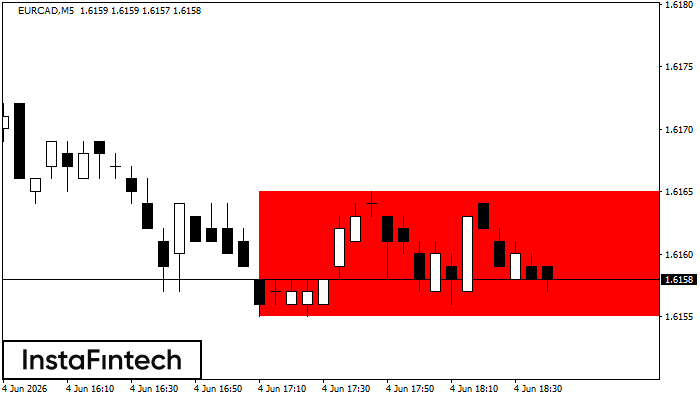
EURCAD M5
Bearish Rectangle
According to the chart of M5, EURCAD formed the Bearish Rectangle. The pattern indicates a trend continuation. The upper border is 1.6165, the lower border is 1.6155. The signal means that a short position should be opened after fixing a price below the lower border 1.6155 of the Bearish Rectangle.
EURCAD M5
Head and Shoulders
The technical pattern called Head and Shoulders has appeared on the chart of EURCAD M5. There are weighty reasons to suggest that the price will surpass the Neckline 1.6161/1.6164 after the right shoulder has been formed. So, the trend is set to change with the price heading for 1.6149.
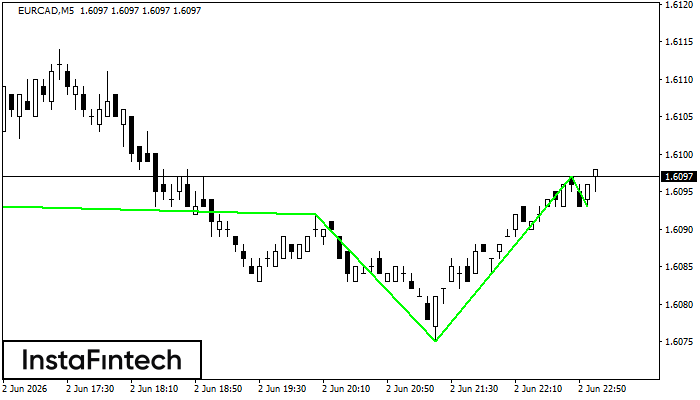
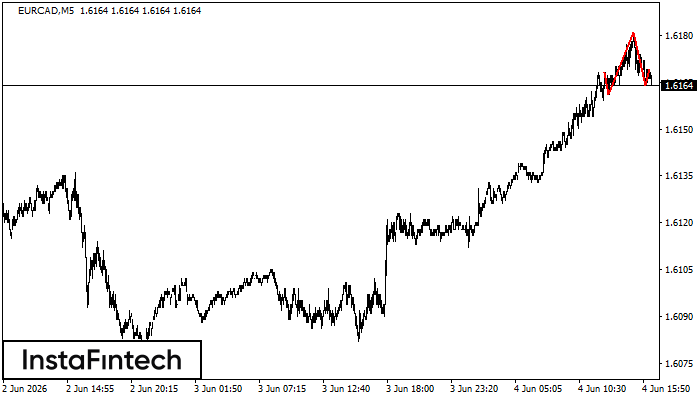
EURCAD M5
Inverse Head and Shoulder
According to the chart of M5, EURCAD formed the Inverse Head and Shoulder pattern. The Head’s top is set at 1.6097 while the median line of the Neck is found at 1.6075/1.6093. The formation of the Inverse Head and Shoulder pattern evidently signals a reversal of the downward trend. In other words, in case the scenario comes true, the price of EURCAD will go towards 1.6112