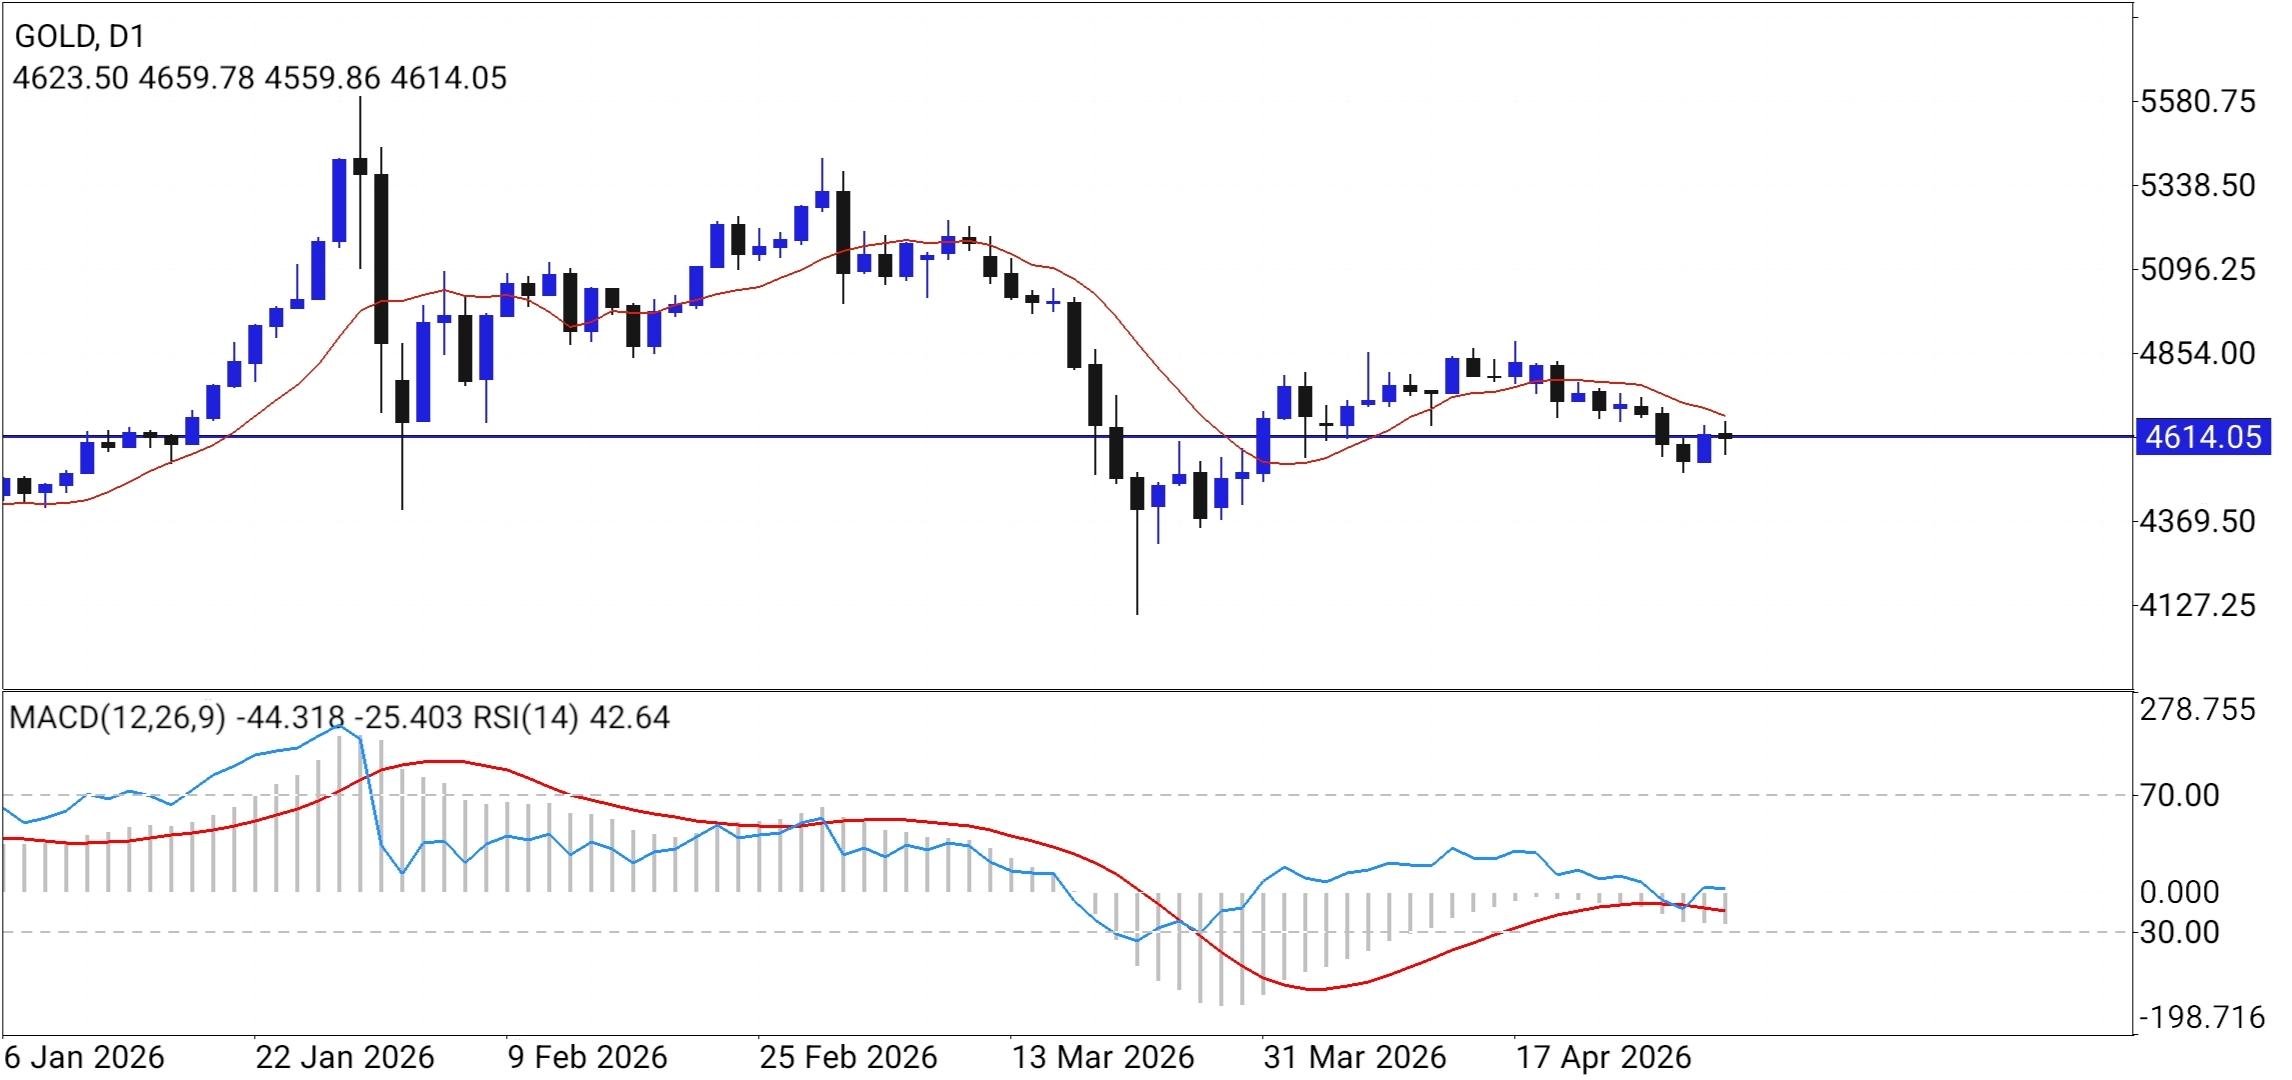
 GOLD Daily Timeframe Analysis 3 May 2026
 Based on the daily chart and current market data for May 3, 2026, Gold (XAUUSD) is currently navigating a complex corrective phase following its massive rally to the $5,580.75 peak earlier this year. The price action is presently consolidated around the $4,614.05 level, which serves as a critical pivot point. Technically, the metal is trading below its 50-day moving average (indicated by the red line on your chart), which now acts as a dynamic resistance hurdle near the $4,842 mark. The MACD indicator shows a bearish crossover with the signal line trending below zero, suggesting that while the immediate selling pressure has slowed, the momentum remains skewed to the downside. However, the RSI (Relative Strength Index) at 42.64 indicates that the market is not yet oversold, leaving room for further potential testing of deeper support levels or a period of sideways accumulation before the next major trend is established. The daily chart reveals a descending channel pattern where bulls are struggling to reclaim the psychological $4,700 level. After the sharp rejection from the late January highs, Gold found significant support near the $4,376 zone (the 0.618 Fibonacci retracement level). Current price action shows a series of lower highs, but the $4,560–$4,600 area is providing a temporary floor. For a bullish reversal to be confirmed, we would need to see a daily close above the recent swing high of $4,854 and a bullish flip of the MACD histogram. Until then, the market appears to be in a wait-and-see mode, likely influenced by upcoming U.S. labor market data (NFP) and geopolitical shifts in the Middle East.
Trade Setup: The Pivot Breakout Strategy • Market Bias: Neutral to Bearish (Short-term) • Entry (Sell): Below $4,590 (Wait for a H4 candle close below this level) • Take Profit 1: $4,376 (Major Fibonacci Support) • Take Profit 2: $4,127 (Long-term horizontal support) • Stop Loss: $4,730 (Above the recent minor peak)
Bullish Alternative: If Gold manages to close above $4,854 on the daily timeframe, look for a long entry targeting the $5,100 zone.
Note: The current proximity to the $4,600 level makes this a high-volatility zone. Ensure you are utilizing proper risk management, as a break in either direction could trigger a 200–300 pip move quickly.
*The market analysis posted here is meant to increase your awareness, but not to give instructions to make a trade
 English
 Русский
 Bahasa Indonesia
 Bahasa Malay
 ไทย
ไทย Español
 Deutsch
 Български
 Français
 Tiếng Việt
 中文
中文 বাংলা
বাংলা हिन्दी
 Čeština
 Українська
 Română
