English
  Русский
 Bahasa Indonesia
 Bahasa Malay
 ไทย
ไทย Español
 Deutsch
 Български
 Français
 Tiếng Việt
 中文
中文 বাংলা
বাংলা हिन्दी
 Čeština
 Українська
 Română

Technical Market Outlook:
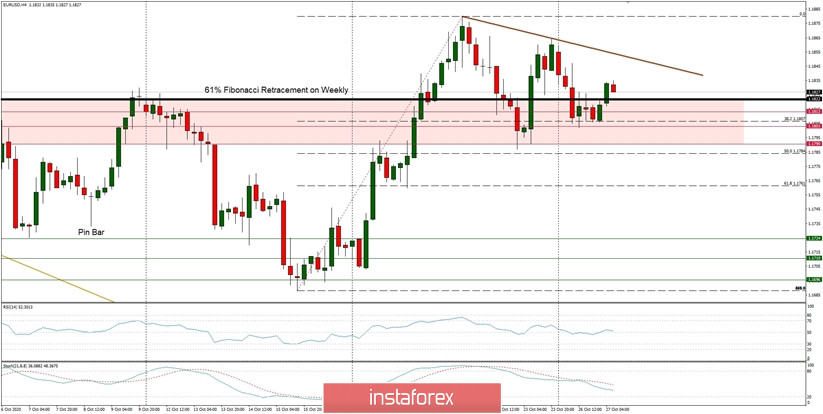
The EUR/USD pair has been trying again to rally towards the level of 1.1880, but still trades below the short-term trend line resistance, just around the 1.1822. This level is a 61% Fibonacci retracement on the weekly tome frame chart as well and had been tested many times during the last month. There might be a Bullsih Flag pattern in progress on H4 time frame. The market is coming off the overbought conditions and the momentum is neutral to positive, so there are still a chance for bulls for another wave up. Only a sustained violation of the level of 1.1761 will trigger more aggressive sell off towards 1.1724 and below.
Weekly Pivot Points:
WR3 - 1.2123
WR2 - 1.1991
WR1 - 1.1943
Weekly Pivot - 1.1823
WS1 - 1.1766
WS2 - 1.1638
WS3 - 1.1589
Trading Recommendations:
Since the middle of March 2020 the main trend is on EUR/USD pair has been up, which can be confirmed by almost 10 weekly up candles on the weekly time frame chart and 4 monthly up candles on the monthly time frame chart. The recent correction towards the level of 1.1612 seems to be completed and now market is ready for another wave up. This means any local corrections should be used to buy the dips until the key technical support is broken. The key long-term technical support is seen at the level of 1.1445. The key long-term technical resistance is seen at the level of 1.2555.