 English
  Русский
 Bahasa Indonesia
 Bahasa Malay
 ไทย
ไทย Español
 Deutsch
 Български
 Français
 Tiếng Việt
 中文
中文 বাংলা
বাংলা हिन्दी
 Čeština
 Українська
 Română

Trend analysis
It is possible that the price from the level of 1.2941 (closing of the October monthly candlestick) will decline this month with the first goal of 1.2867 - 21 EMA (black thin line). If this level is tested, it is possible to further move below towards the next goal of 1.2689 - a pullback level of 38.2% (red dashed line).
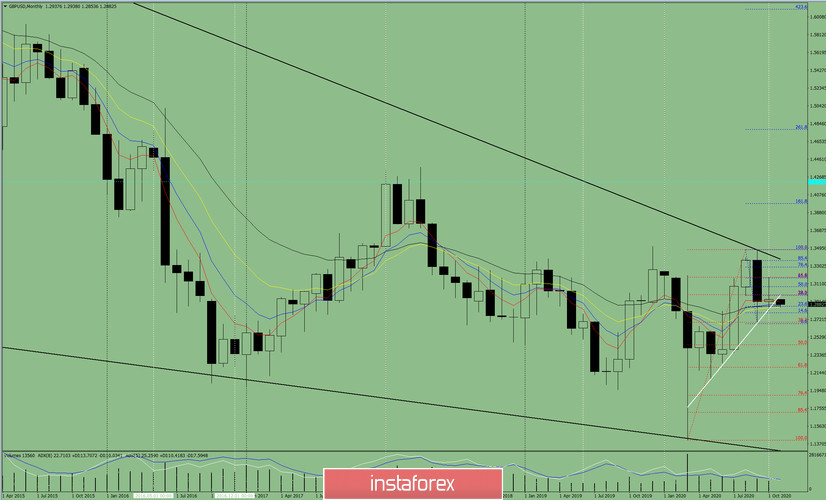
Figure: 1 (monthly chart).
Indicator analysis:
- indicator analysis - down;
- Fibonacci levels - down;
- volumes - down;
- candlestick analysis - down;
- trend analysis - down;
- Bollinger lines - down;
A decline can be concluded based on the comprehensive analysis.
The overall result of calculating the candlestick of the GBP/USD pair on the monthly chart: the price will most likely decline without the first upper shadow (first week of the month - black) in the monthly black candlestick and second lower shadow (last week - black).
Most likely scenario: the price from the level of 1.2941 (closing of the October monthly candlestick) is likely to decline this month with the first goal of 1.2867 - 21 EMA (black thin line). If this level is tested, it is possible to further move below towards the next goal of 1.2689 - a pullback level of 38.2% (red dashed line).
An alternative scenario: a decline with the goal of 1.2868 - 21 EMA (black thin line) from the level of 1.2941 (closing of the October monthly candle) is possible. In case that this level is tested, rising towards the goal of 1.2992 - a pullback level of 38.2% (red dashed line) can be considered. If this level is broken upwards, we can continue to further rise towards the level of 1.3075 - a pullback level of 50% (blue dashed line).