 English
  Русский
 Bahasa Indonesia
 Bahasa Malay
 ไทย
ไทย Español
 Deutsch
 Български
 Français
 Tiếng Việt
 中文
中文 বাংলা
বাংলা हिन्दी
 Čeština
 Українська
 Română

Last Friday, the pair had an unsuccessful attempt to overcome the resistance line at 1.1879 (white thick line), and it went down testing almost the retracement level of 23.6% at 1.1844 (red dotted line). Today the price may continue to move up according to an economic calendar news, it is expected at 8.30 UTC (euro).
Trend analysis (Fig. 1).
Today, the market may continue to move upward from the level of 1.1855 (closing of the Friday's daily candle) with the first upper target of 85.4% retracement level at 1.1894 (blue dotted line). In case of testing this line, we are waiting for the continuation of the upper work with the target at 1.1920 - the upper fractal (daily candle from 11/09/2020).
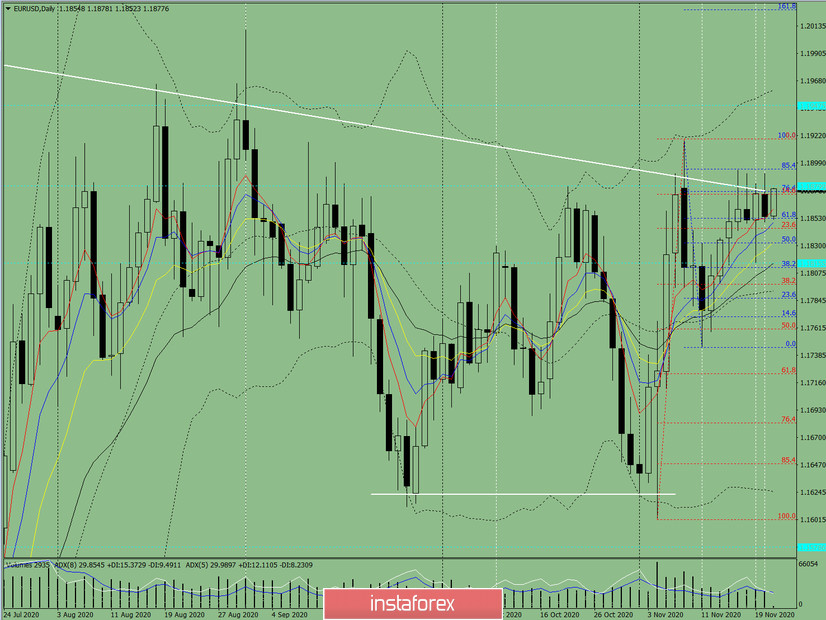
Figure: 1 (daily chart).
Comprehensive Analysis:
- Indicator Analysis - up
- Fibonacci levels - up
- Volumes - up
- Candlestick Analysis - down
- Trend Analysis - down
- Bollinger Lines - up
- Weekly Chart - up
General Conclusion:
Today, the price may move upward with the target of 85.4% retracement level at 1.1894 (blue dotted line). In case of testing this line, we are waiting for the continuation of the upper work with the target at 1.1920 - the upper fractal (daily candle from 11/09/2020).
Alternative scenario: from the level of 1.1835 (close of Friday's daily candle) there will be a work going upward in order to reach the resistance line at 1.1877 (white thick line). In case of testing this line, there will be a work going down with the target at 1.1844 - the lower retracement level of 23.6% (red dotted line).