 English
  Русский
 Bahasa Indonesia
 Bahasa Malay
 ไทย
ไทย Español
 Deutsch
 Български
 Français
 Tiếng Việt
 中文
中文 বাংলা
বাংলা हिन्दी
 Čeština
 Українська
 Română

Trend analysis (Fig. 1).
Today, the market may continue to move upward from the level of 1.3280 (closing of last Friday's daily candlestick) with the target of 1.3322 - the resistance line (white bold line). When testing this line, upward movement should be continued with the goal of 1.3436 – the target level of 161.8% (blue dotted line).
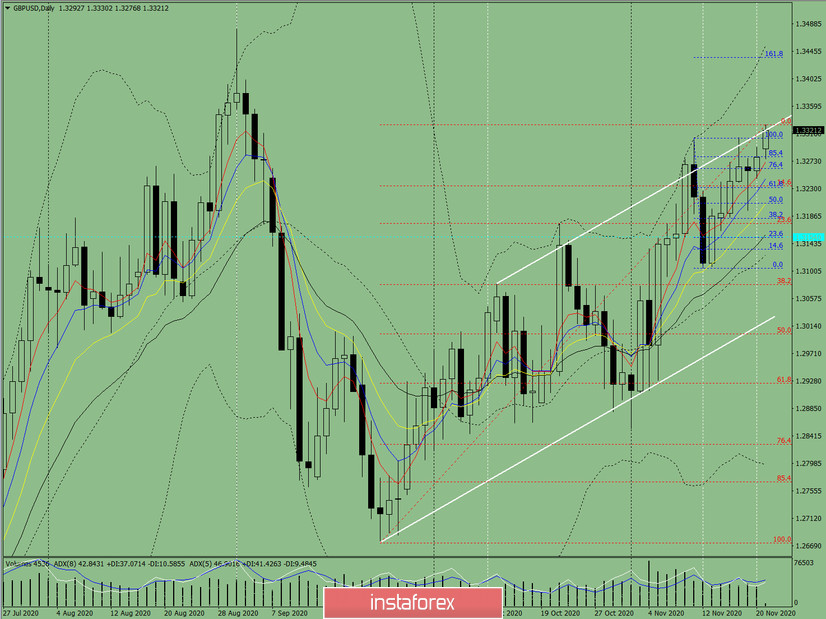
Figure 1 (Daily chart).
Comprehensive analysis:
- Indicator analysis - up;
- Fibonacci levels - up;
- Volumes - up;
- Candlestick analysis - down;
- Trend analysis - up;
- Bollinger bands - up;
- Weekly chart - up.
General conclusion:
Today, the price may continue to move upward with the target of 1.3322 - the resistance line (white bold line). When testing this line, upward movement should be continued with the goal of 1.3436 – the target level of 161.8% (blue dotted line).
Alternative scenario: from the level of 1.3280 (closing of last Friday's daily candlestick), the price may continue to move up with the target of 1.3322 - the resistance line (white bold line). When testing this line, work downward with the goal of 1.3234 - a 14.6% pullback level (red dotted line).