 English
  Русский
 Bahasa Indonesia
 Bahasa Malay
 ไทย
ไทย Español
 Deutsch
 Български
 Français
 Tiếng Việt
 中文
中文 বাংলা
বাংলা हिन्दी
 Čeština
 Українська
 Română

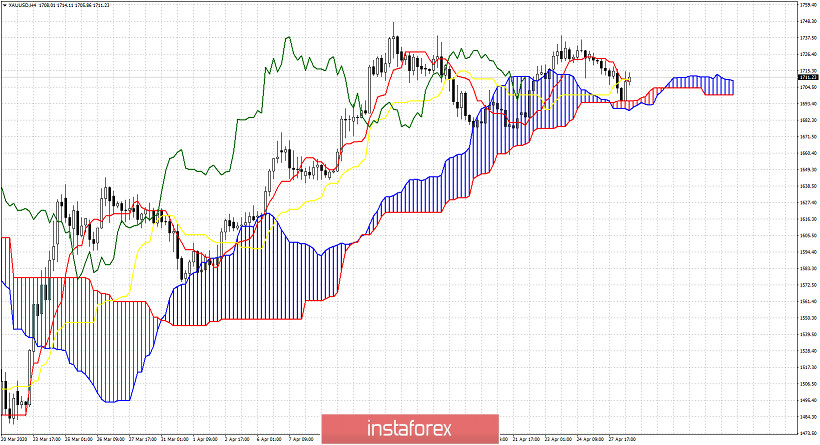
Gold price is challenging short-term Ichimoku cloud support and so far bulls remain in control of the trend. Gold price pulled back towards $1,690 and is now bouncing back above $1,700. Gold price remains vulnerable to a deeper decline but we should not ignore the bullish Head and Shoulders pattern we mentioned in our last analysis.
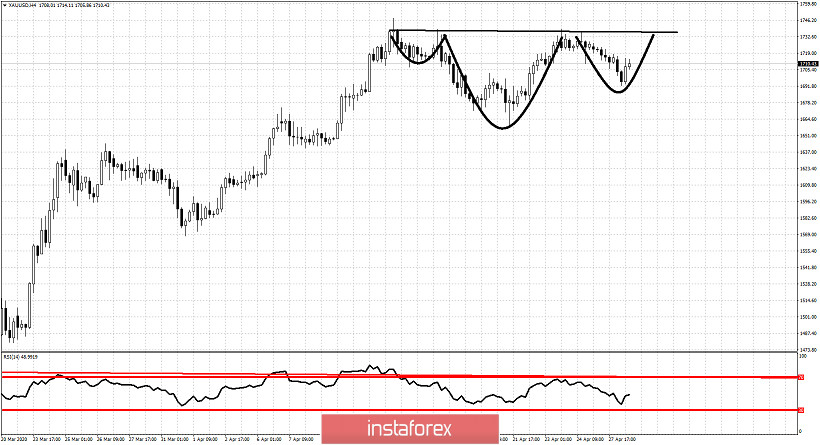
On the other hand we might be forming a right hand shoulder as we mentioned in yesterday's analysis. If price manages to break above $1,737 we should see a strong move higher to new 2020 highs. If however price breaks below today's lows, we should be very confident that a top is in. Gold remains vulnerable to a big decline towards $1,600. I do not give many chances of this up trend to stay valid for much longer.