 English
  Русский
 Bahasa Indonesia
 Bahasa Malay
 ไทย
ไทย Español
 Deutsch
 Български
 Français
 Tiếng Việt
 中文
中文 বাংলা
বাংলা हिन्दी
 Čeština
 Українська
 Română

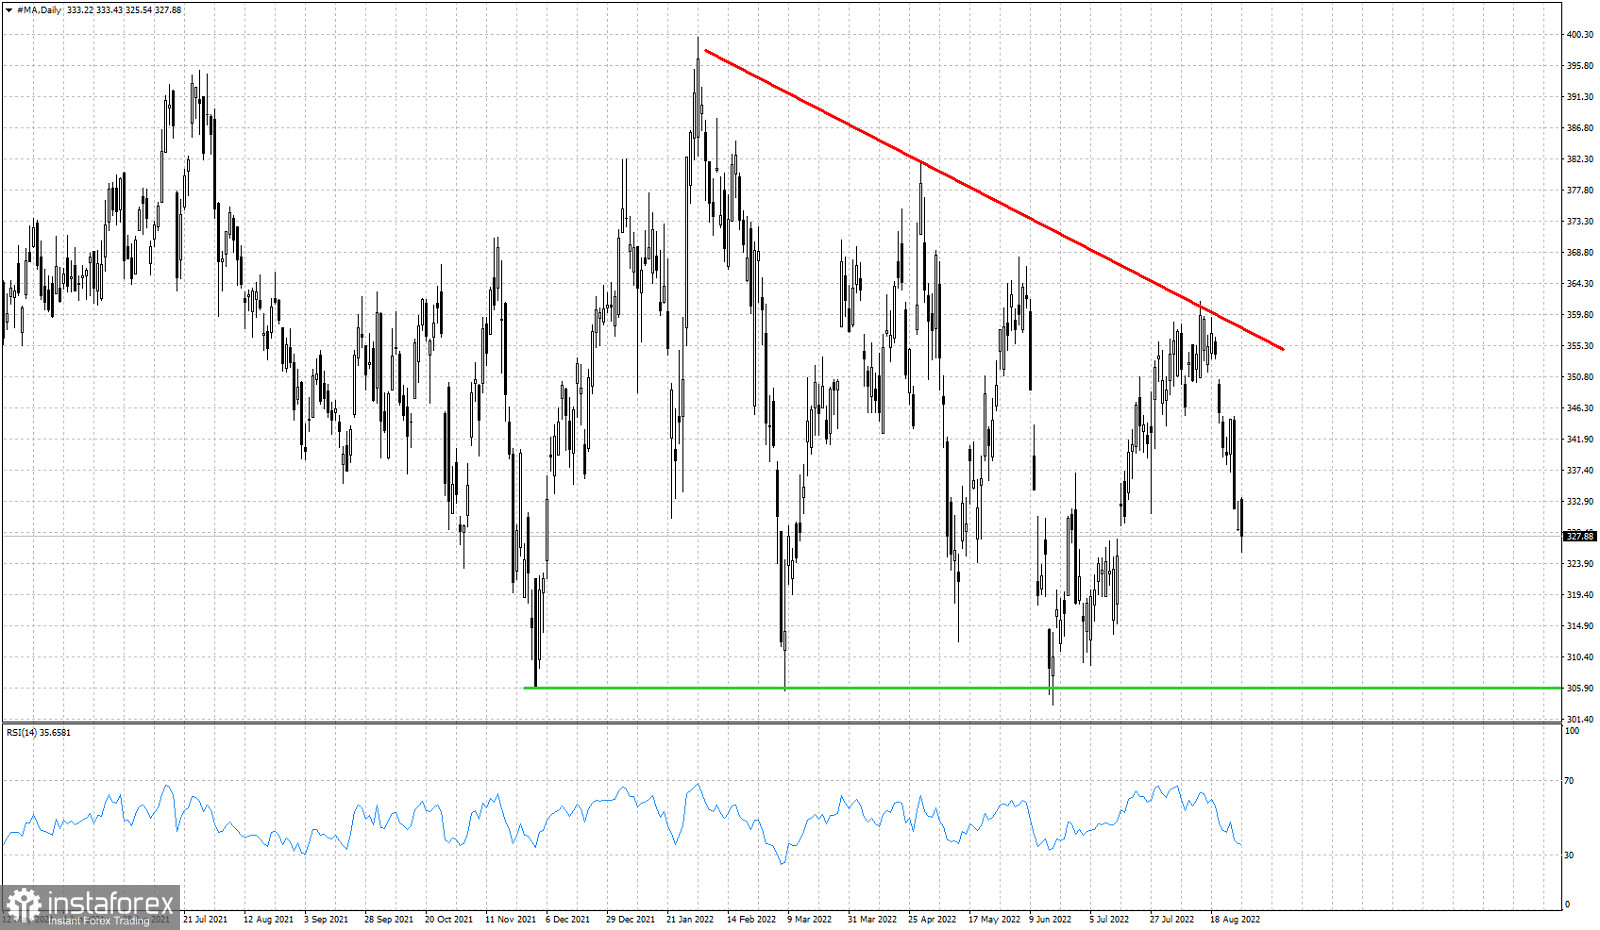
Red line- upper triangle boundary
Green line- lower triangle boundary
In previous posts we warned bulls in MA stock to be careful as a rejection at the resistance around $360 could lead to another pull back towards $300. The descending triangle pattern we have noted since earlier posts, is so far following the bearish scenario. Price tests the upper triangle boundary, gets rejected and turns lower towards the lower triangle boundary. In this case the lower triangle boundary at $300 is getting closer. We continue to expect MA stock price to move towards the green support line around $300. We remain bearish as long as price is below the red trend line resistance.