 English
  Русский
 Bahasa Indonesia
 Bahasa Malay
 ไทย
ไทย Español
 Deutsch
 Български
 Français
 Tiếng Việt
 中文
中文 বাংলা
বাংলা हिन्दी
 Čeština
 Українська
 Română

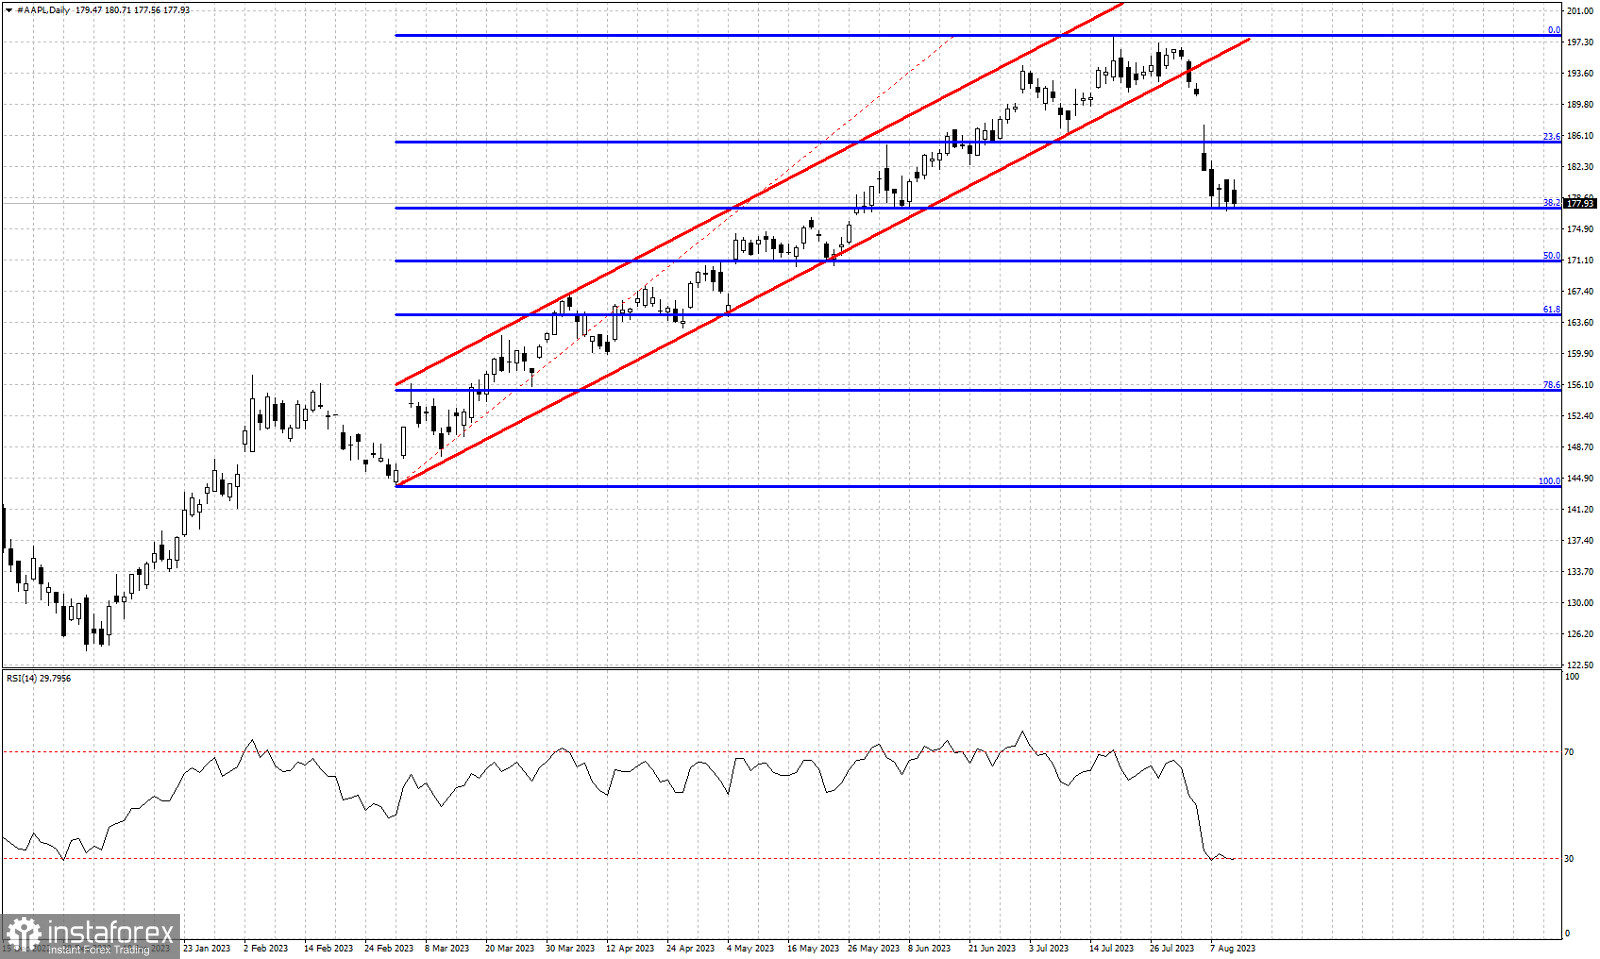
Red lines- bullish channel
Blue lines- Fibonacci retracement levels
Apple stock price is under pressure over the last few days. Price has broken the bullish channel it was and has already reached the 38% Fibonacci retracement of the last upward leg. In a previous analysis on July 25th, we warned bulls that the RSI has started providing bearish divergence warnings and that a break below $189 would confirm a short-term trend reversal. Price has provided this new bearish signal and is now trading around the 38% Fibonacci retracement level which is short-term support. A break below the 38% Fibonacci retracement will open the way for a move towards $171