 English
  Русский
 Bahasa Indonesia
 Bahasa Malay
 ไทย
ไทย Español
 Deutsch
 Български
 Français
 Tiếng Việt
 中文
中文 বাংলা
বাংলা हिन्दी
 Čeština
 Українська
 Română

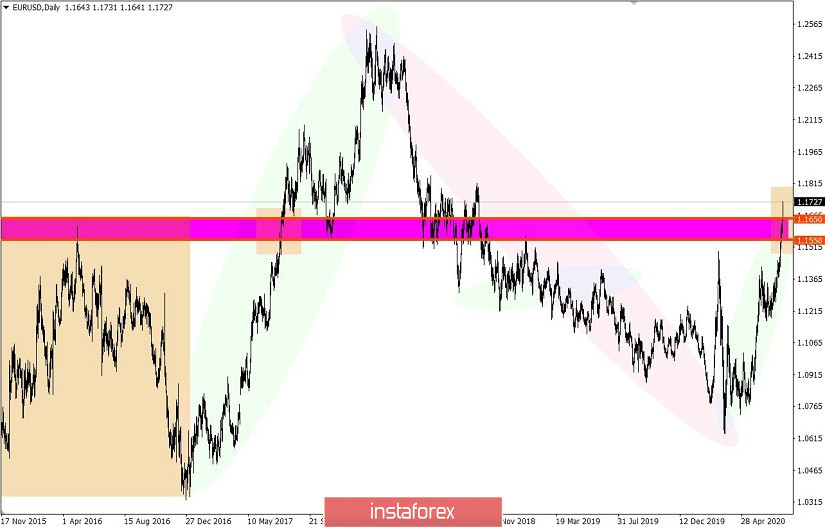
The European currency has recently become so expensive that it is now overbought and has no boundaries. Its exchange rate since the beginning of July has led to a movement that is vertical, in which the medium-term downward trend was greatly affected.
Back in mid-May, the rate of EUR / USD fluctuated around the level of 1.0775. Now, the movement has passed to almost +1,000 points, and that is 56% relative to the downward trend in January 2018. Hence, the main question now is whether this current acceleration will become the new medium-term trend in trading.
For the last 5-10 weeks, the US dollar has been selling-off in the market, and investors are quite happy with this. There is speculation that the depreciation of the currency is deliberate, and it will help the US economy become the most agile in the global trading arena. At the same time, Bloomberg said that a cheap dollar may become a target for long positions at the end of August, thereby preparing strategic positions for the autumn season.
Thus, there are clear doubts on the long-term upward trend and a growing confidence that there is currently market manipulation.
Nevertheless, volatility was not lower than the daily average, which means that activity in the market is high, so is the speculative mood of traders.
As discussed in the previous review , traders worked on a local slowdown, in which an upward movement was set towards the level of 1.1650. The transactions were placed after a consolidation above the said level.
So, in the daily chart, there is an almost vertical price movement, where the quote broke through the area 1.1550 / 1.1650 without much difficulty. In addition, the same movement was also observed before, on almost the same date as this time, on July 21-26, 2017.
As for news, the reports published last Friday included the preliminary data on the index of business activity in Europe, which came out with positive dynamics. The index in the service sector rose from 48.3 to 54.8, while the manufacturing sector recorded an increase from 47.4 to 51.1. The composite business activity index also grew from 48.5 to 54.8.
Such figures led to a rise in the euro and decline in the US dollar on the trading chart.
In the afternoon, a similar data for the United States came out, where a growth in the index was also recorded. According to the report, the PMI in the US manufacturing sector rose from 49.8 to 51.3 (forecast 51.5), while the service sector grew from 47.9 to 49.6 (forecast 51.0).
Such statistics further declined the US dollar in the trading chart.
Today, data on durable goods in the US will be published, in which economists forecast orders to grow by 5%. If the real data comes out worse than the forecast, the US dollar will remain declining, but if it turns out better, a very sharp change towards increasing will occur in the USD trading chart.

Further development
Analyzing the current trading chart, we can see the further rise of the European currency, in which the quotes reached new highs and increased the volatility. Because of this, a convergence in the area of 1.1800 is possible, but within it the movement may stop, and if the data on durable goods in the United States turns out to be at a level of 5% or higher, a reversal towards 1.1650 -1.1550 will occur immediately.
But, an alternative scenario will arise if the data turns out to be worse than expected. The quote will consolidate above 1.1800, overheating the European currency.
Indicator analysis
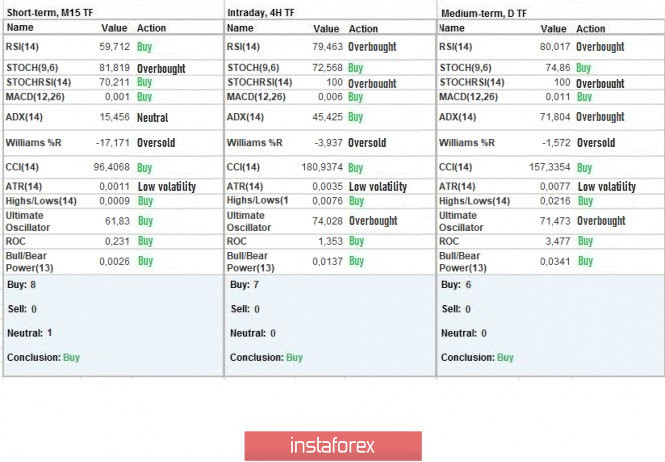
Analyzing the different sectors of time frames (TF), we can see that the indicators of technical instruments on the minute, hourly and daily periods signal "buy" due to the movement of quotes towards the highs of the current year.
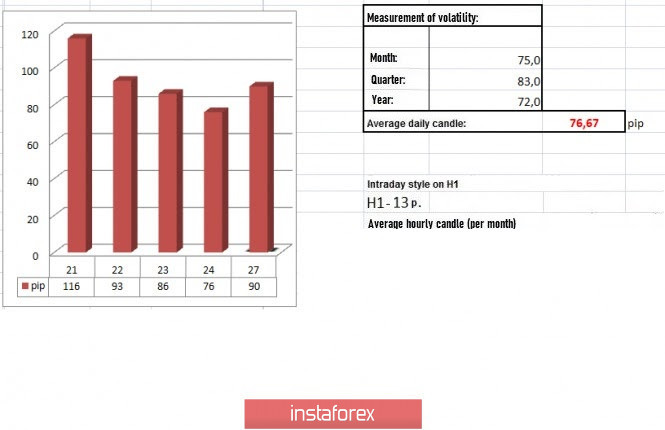
Weekly volatility / Volatility measurement: Month; Quarter; Year
The measurement of volatility reflects the average daily fluctuation, calculated per Month / Quarter / Year.
(July 27 was built, taking into account the time the article is published)
The volatility at this current time is 90 points, which is 18% higher than the average daily value. It is assumed that speculative activity is driving up the excitement in the market, which may lead to further increase in volatility.
Key levels
Resistance zones: 1.1650 *; 1.1720 **; 1.1850 **; 1.2100
Support Zones: 1,1500 1.1350; 1.1250 *; 1.1.180 **; 1.1080; 1.1000 ***; 1.0850 **; 1.0775 *; 1.0650 (1.0636); 1.0500 ***; 1.0350 **; 1.0000 ***.
* Periodic level
** Range level
*** Psychological level