 English
  Русский
 Bahasa Indonesia
 Bahasa Malay
 ไทย
ไทย Español
 Deutsch
 Български
 Français
 Tiếng Việt
 中文
中文 বাংলা
বাংলা हिन्दी
 Čeština
 Українська
 Română
FX.co ★ Patterns #EBAY | eBay Inc. Stock Price

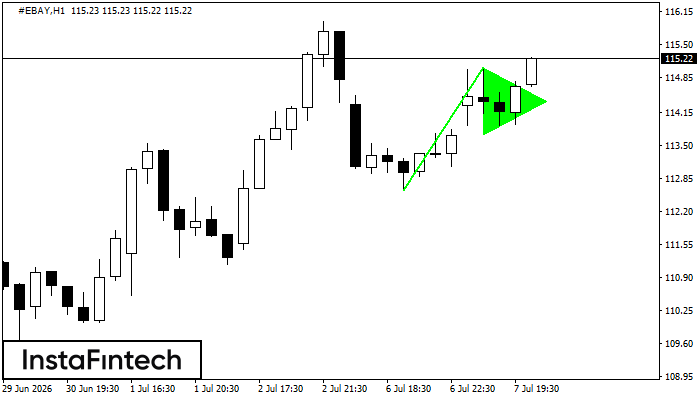
#EBAY H1
Bullish pennant
The Bullish pennant graphic pattern has formed on the #EBAY H1 instrument. This pattern type falls under the category of continuation patterns. In this case, if the quote can breaks out high, is expected to continue the upward trend to level 115.44.
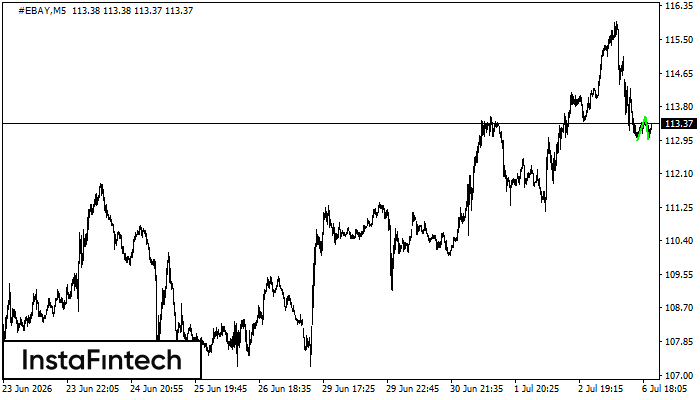
#EBAY M5
Double Bottom
The Double Bottom pattern has been formed on #EBAY M5. This formation signals a reversal of the trend from downwards to upwards. The signal is that a buy trade should be opened after the upper boundary of the pattern 113.55 is broken. The further movements will rely on the width of the current pattern 60 points.
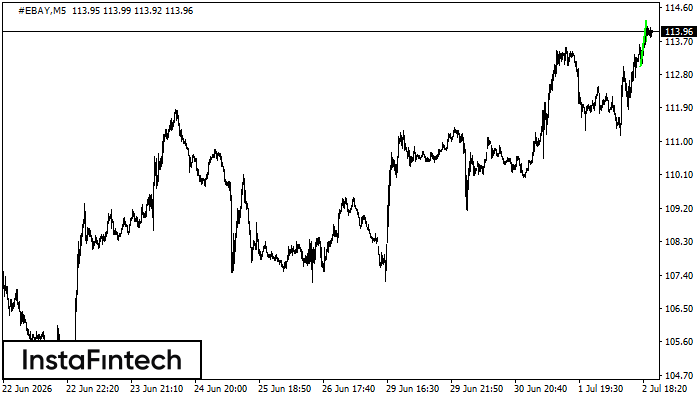
#EBAY M5
Bullish pennant
The Bullish pennant graphic pattern has formed on the #EBAY M5 instrument. This pattern type falls under the category of continuation patterns. In this case, if the quote can breaks out high, is expected to continue the upward trend to level 114.41.
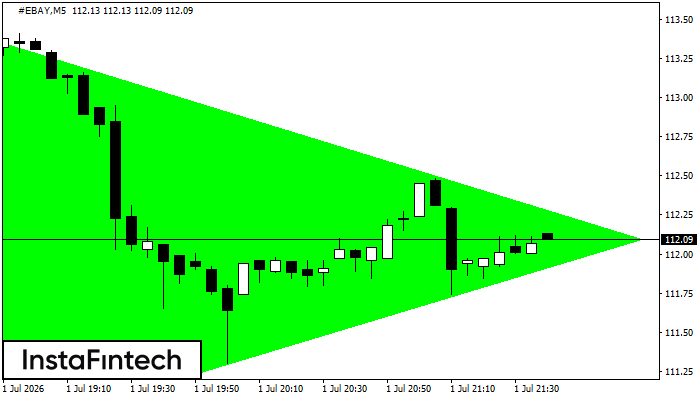
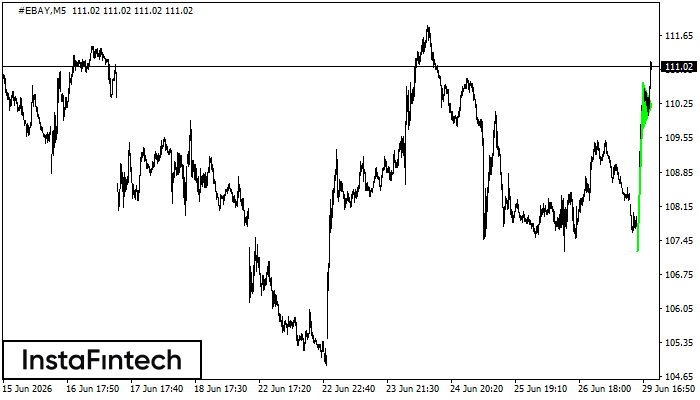
#EBAY M5
Bullish Symmetrical Triangle
According to the chart of M5, #EBAY formed the Bullish Symmetrical Triangle pattern, which signals the trend will continue. Description. The upper border of the pattern touches the coordinates 113.54/112.09 whereas the lower border goes across 110.67/112.09. The pattern width is measured on the chart at 287 pips. If the Bullish Symmetrical Triangle pattern is in progress during the upward trend, this indicates the current trend will go on. In case 112.09 is broken, the price could continue its move toward 112.24.
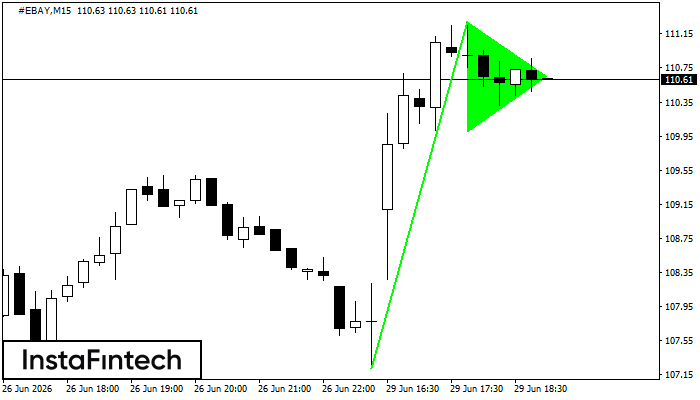
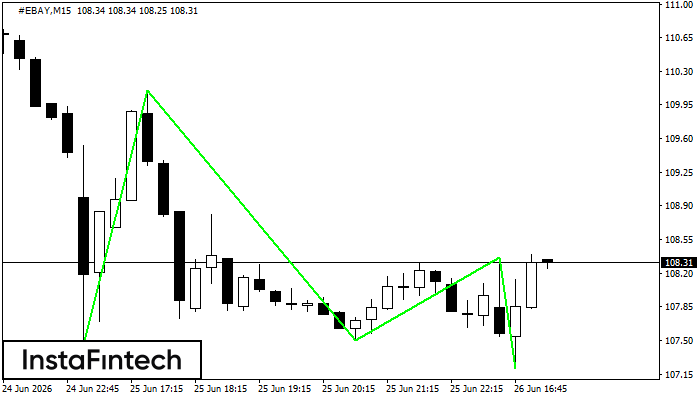
#EBAY M15
Bullish pennant
The Bullish pennant graphic pattern has formed on the #EBAY M15 instrument. This pattern type falls under the category of continuation patterns. In this case, if the quote can breaks out high, is expected to continue the upward trend to level 111.51.
#EBAY M5
Bullish pennant
The Bullish pennant pattern is formed on the #EBAY M5 chart. It is a type of the continuation pattern. Supposedly, in case the price is fixed above the pennant’s high of 110.69, a further uptrend is possible.
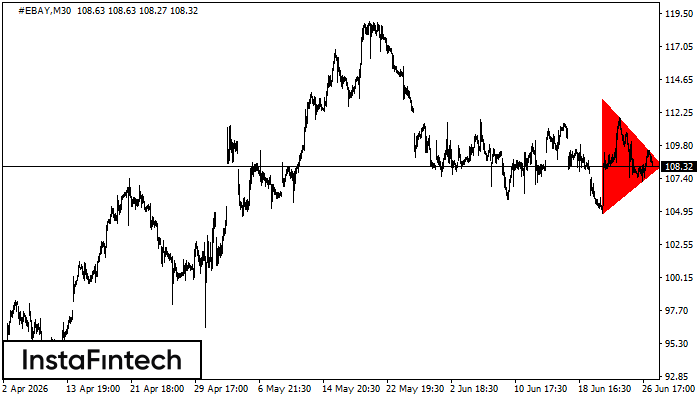
#EBAY M30
Bearish Symmetrical Triangle
According to the chart of M30, #EBAY formed the Bearish Symmetrical Triangle pattern. Trading recommendations: A breach of the lower border 104.87 is likely to encourage a continuation of the downward trend.
#EBAY M5
Double Top
The Double Top pattern has been formed on #EBAY M5. It signals that the trend has been changed from upwards to downwards. Probably, if the base of the pattern 109.00 is broken, the downward movement will continue.
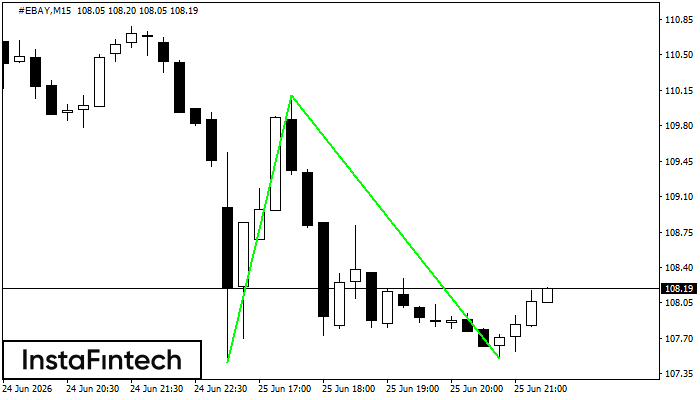
#EBAY M15
Triple Bottom
The Triple Bottom pattern has formed on the chart of the #EBAY M15 trading instrument. The pattern signals a change in the trend from downwards to upwards in the case of breakdown of 110.10/108.36.
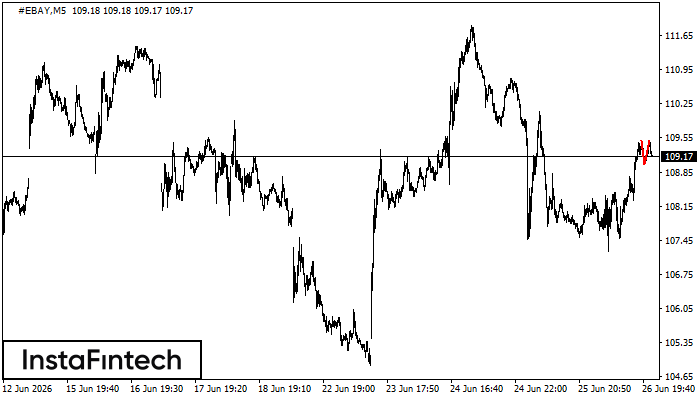
#EBAY M15
Double Bottom
The Double Bottom pattern has been formed on #EBAY M15; the upper boundary is 110.10; the lower boundary is 107.50. The width of the pattern is 264 points. In case of a break of the upper boundary 110.10, a change in the trend can be predicted where the width of the pattern will coincide with the distance to a possible take profit level.