 English
  Русский
 Bahasa Indonesia
 Bahasa Malay
 ไทย
ไทย Español
 Deutsch
 Български
 Français
 Tiếng Việt
 中文
中文 বাংলা
বাংলা हिन्दी
 Čeština
 Українська
 Română
FX.co ★ Patterns EURUSD | Euro (EUR) to US Dollar (USD) Rate in the Forex market

EURUSD M15
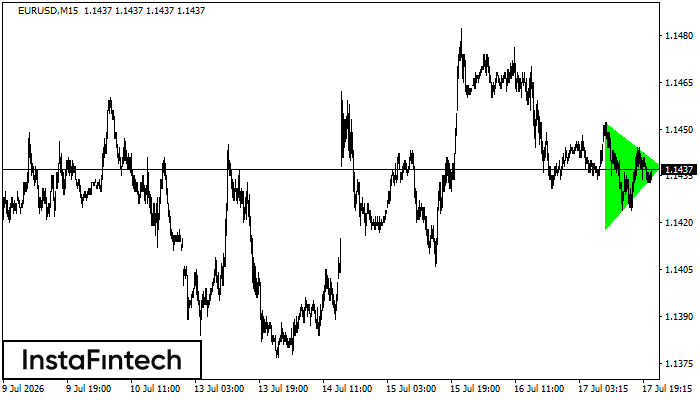
Bullish Symmetrical Triangle
According to the chart of M15, EURUSD formed the Bullish Symmetrical Triangle pattern. The lower border of the pattern touches the coordinates 1.1418/1.1438 whereas the upper border goes across 1.1452/1.1438. If the Bullish Symmetrical Triangle pattern is in progress, this evidently signals a further upward trend. In other words, in case the scenario comes true, the price of EURUSD will breach the upper border to head for 1.1460.
EURUSD M15
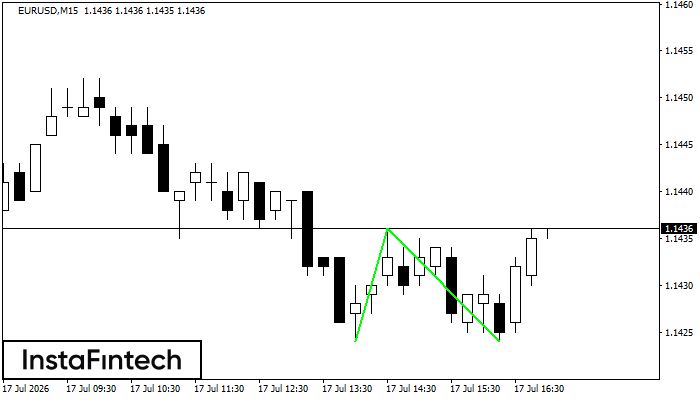
Double Bottom
The Double Bottom pattern has been formed on EURUSD M15; the upper boundary is 1.1436; the lower boundary is 1.1424. The width of the pattern is 12 points. In case of a break of the upper boundary 1.1436, a change in the trend can be predicted where the width of the pattern will coincide with the distance to a possible take profit level.
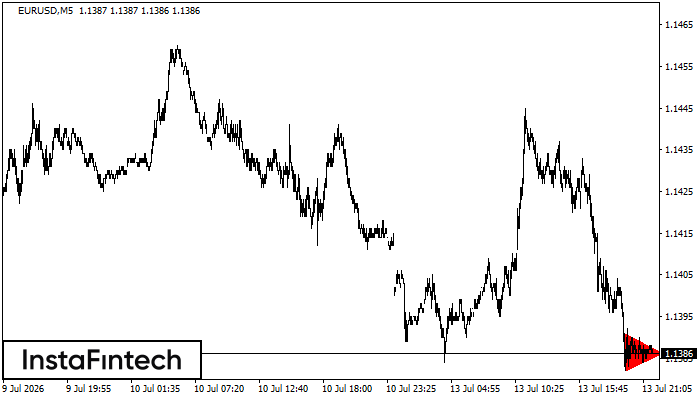
EURUSD M5
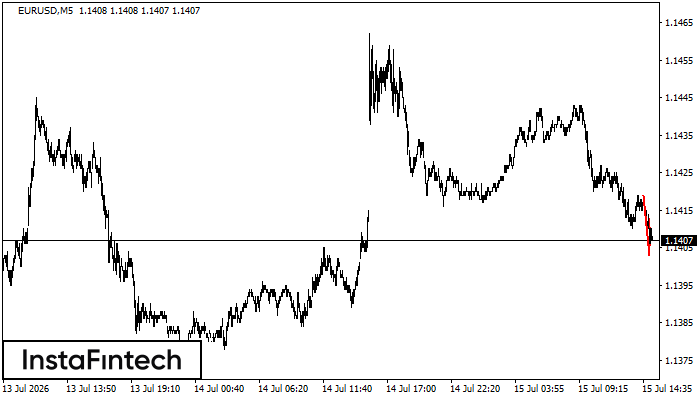
Bearish pennant
The Bearish pennant pattern has formed on the EURUSD M5 chart. It signals potential continuation of the existing trend. Specifications: the pattern’s bottom has the coordinate of 1.1403; the projection of the flagpole height is equal to 16 pips. In case the price breaks out the pattern’s bottom of 1.1403, the downtrend is expected to continue for further level 1.1388.
EURUSD M5
Double Bottom
The Double Bottom pattern has been formed on EURUSD M5. This formation signals a reversal of the trend from downwards to upwards. The signal is that a buy trade should be opened after the upper boundary of the pattern 1.1427 is broken. The further movements will rely on the width of the current pattern 7 points.
EURUSD M5
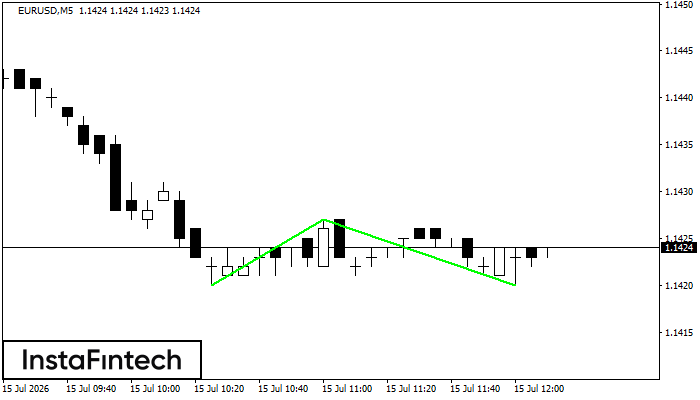
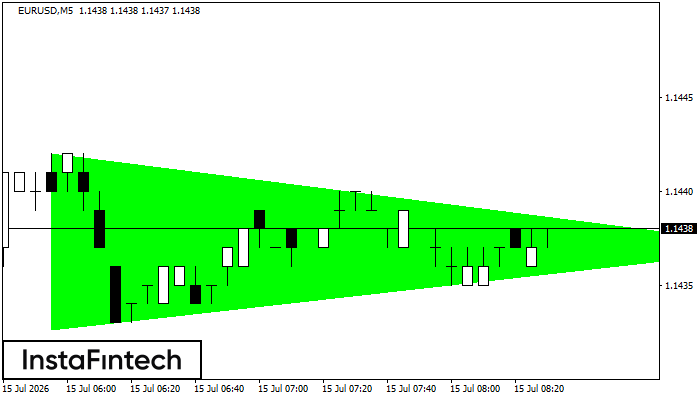
Bullish Symmetrical Triangle
According to the chart of M5, EURUSD formed the Bullish Symmetrical Triangle pattern. Description: This is the pattern of a trend continuation. 1.1442 and 1.1433 are the coordinates of the upper and lower borders respectively. The pattern width is measured on the chart at 9 pips. Outlook: If the upper border 1.1442 is broken, the price is likely to continue its move by 1.1452.
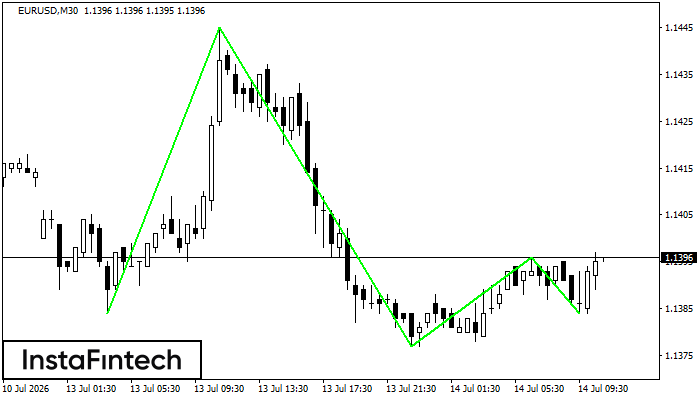
EURUSD M30
Triple Bottom
The Triple Bottom pattern has formed on the chart of EURUSD M30. Features of the pattern: The lower line of the pattern has coordinates 1.1445 with the upper limit 1.1445/1.1396, the projection of the width is 61 points. The formation of the Triple Bottom pattern most likely indicates a change in the trend from downward to upward. This means that in the event of a breakdown of the resistance level 1.1384, the price is most likely to continue the upward movement.
EURUSD H1
Triple Bottom
The Triple Bottom pattern has been formed on EURUSD H1. It has the following characteristics: resistance level 1.1445/1.1396; support level 1.1384/1.1384; the width is 61 points. In the event of a breakdown of the resistance level of 1.1445, the price is likely to continue an upward movement at least to 1.1417.
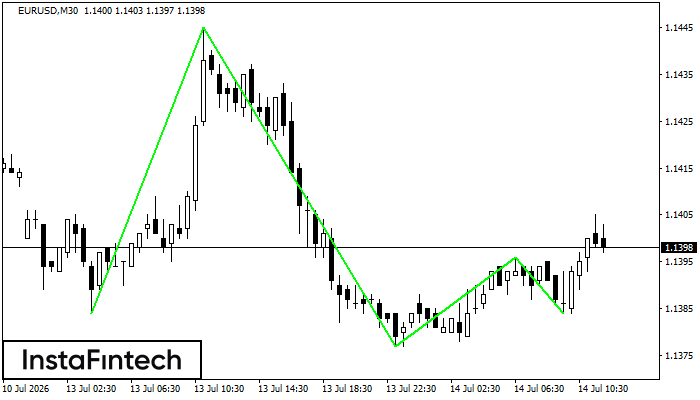
EURUSD M30
Triple Bottom
The Triple Bottom pattern has been formed on EURUSD M30. It has the following characteristics: resistance level 1.1445/1.1396; support level 1.1384/1.1384; the width is 61 points. In the event of a breakdown of the resistance level of 1.1445, the price is likely to continue an upward movement at least to 1.1407.
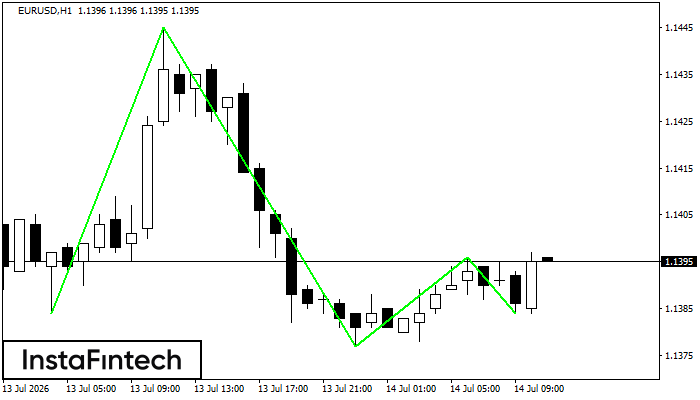
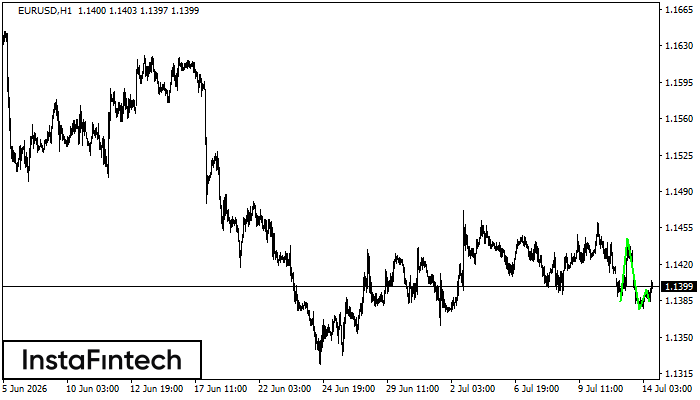
EURUSD H1
Triple Bottom
The Triple Bottom pattern has formed on the chart of EURUSD H1. Features of the pattern: The lower line of the pattern has coordinates 1.1445 with the upper limit 1.1445/1.1396, the projection of the width is 61 points. The formation of the Triple Bottom pattern most likely indicates a change in the trend from downward to upward. This means that in the event of a breakdown of the resistance level 1.1384, the price is most likely to continue the upward movement.
EURUSD M5
Bearish Symmetrical Triangle
According to the chart of M5, EURUSD formed the Bearish Symmetrical Triangle pattern. This pattern signals a further downward trend in case the lower border 1.1382 is breached. Here, a hypothetical profit will equal the width of the available pattern that is -9 pips.