 English
  Русский
 Bahasa Indonesia
 Bahasa Malay
 ไทย
ไทย Español
 Deutsch
 Български
 Français
 Tiếng Việt
 中文
中文 বাংলা
বাংলা हिन्दी
 Čeština
 Українська
 Română
FX.co ★ Patterns #FB | Facebook, Inc. Stock Price

#FB M5
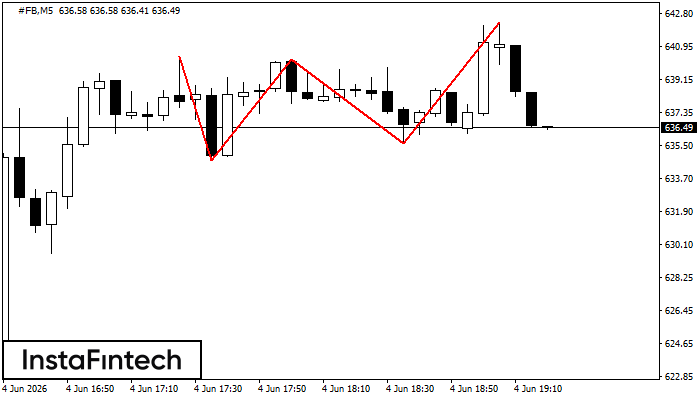
Triple Top
The Triple Top pattern has formed on the chart of the #FB M5. Features of the pattern: borders have an ascending angle; the lower line of the pattern has the coordinates 634.71/635.61 with the upper limit 640.39/642.27; the projection of the width is 568 points. The formation of the Triple Top figure most likely indicates a change in the trend from upward to downward. This means that in the event of a breakdown of the support level of 634.71, the price is most likely to continue the downward movement.
#FB M5
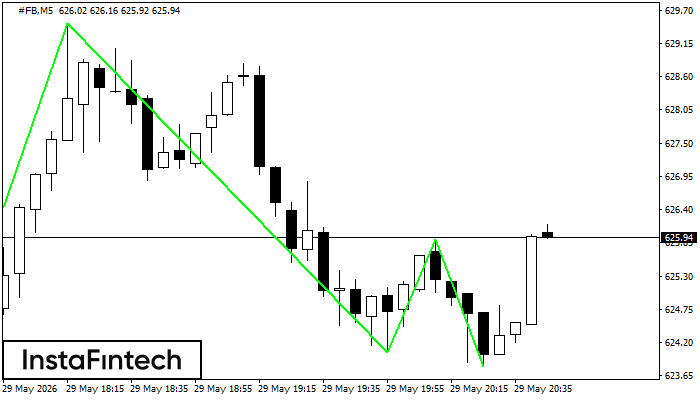
Triple Bottom
The Triple Bottom pattern has formed on the chart of #FB M5. Features of the pattern: The lower line of the pattern has coordinates 629.47 with the upper limit 629.47/625.90, the projection of the width is 607 points. The formation of the Triple Bottom pattern most likely indicates a change in the trend from downward to upward. This means that in the event of a breakdown of the resistance level 623.40, the price is most likely to continue the upward movement.
#FB H1
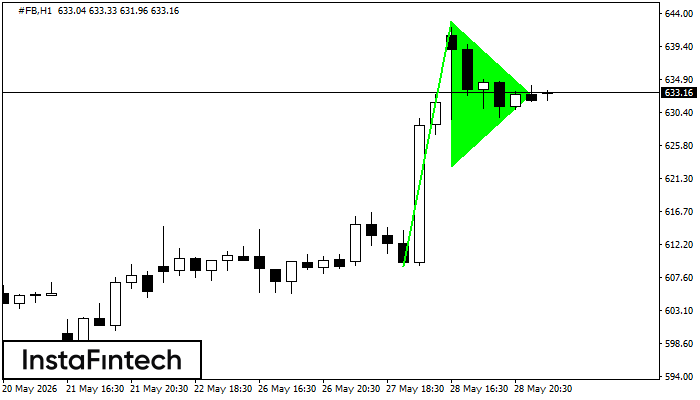
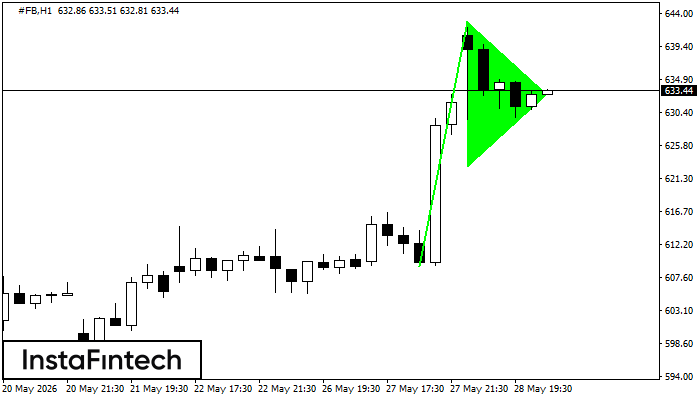
Bullish pennant
The Bullish pennant signal – Trading instrument #FB H1, continuation pattern. Forecast: it is possible to set up a buy position above the pattern’s high of 642.84, with the prospect of the next move being a projection of the flagpole height.
#FB M30
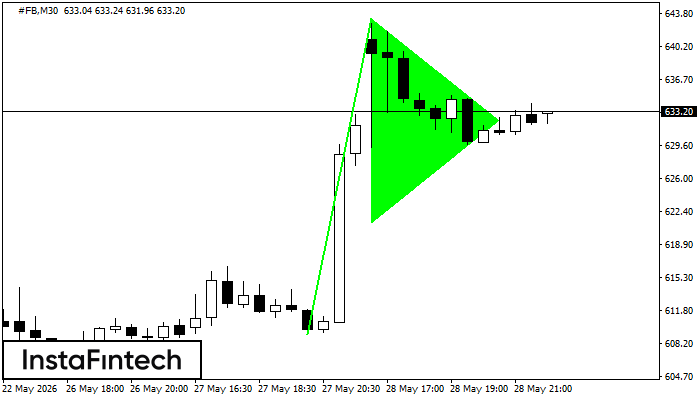
Bullish pennant
The Bullish pennant pattern is formed on the #FB M30 chart. It is a type of the continuation pattern. Supposedly, in case the price is fixed above the pennant’s high of 643.25, a further uptrend is possible.
#FB H1
Bullish pennant
The Bullish pennant signal – Trading instrument #FB H1, continuation pattern. Forecast: it is possible to set up a buy position above the pattern’s high of 642.84, with the prospect of the next move being a projection of the flagpole height.
#FB M5
Triple Bottom
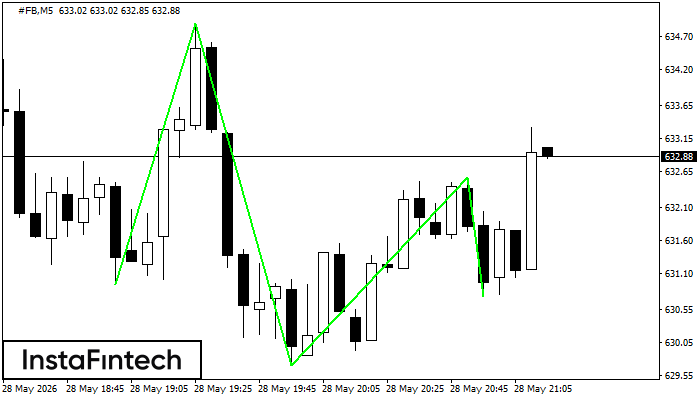
The Triple Bottom pattern has been formed on #FB M5. It has the following characteristics: resistance level 634.90/632.56; support level 630.93/630.75; the width is 397 points. In the event of a breakdown of the resistance level of 634.90, the price is likely to continue an upward movement at least to 629.85.
#FB M30
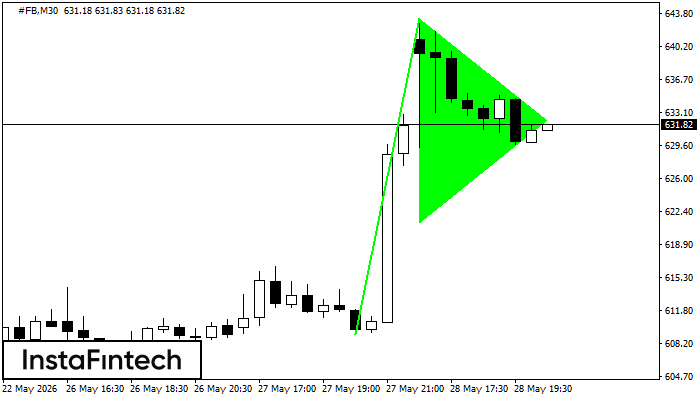
Bullish pennant
The Bullish pennant graphic pattern has formed on the #FB M30 instrument. This pattern type falls under the category of continuation patterns. In this case, if the quote can breaks out high, is expected to continue the upward trend to level 643.55.
#FB M5
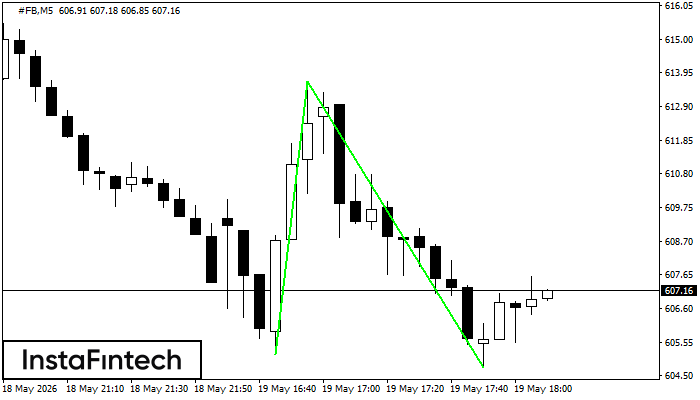
Bearish Symmetrical Triangle
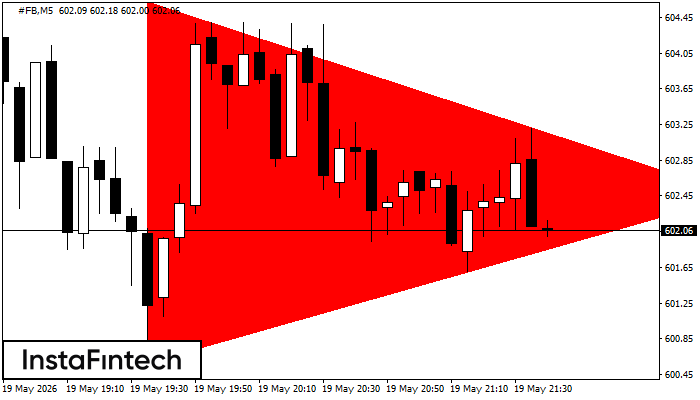
According to the chart of M5, #FB formed the Bearish Symmetrical Triangle pattern. Description: The lower border is 600.58/602.46 and upper border is 604.63/602.46. The pattern width is measured on the chart at -405 pips. The formation of the Bearish Symmetrical Triangle pattern evidently signals a continuation of the downward trend. In other words, if the scenario comes true and #FB breaches the lower border, the price could continue its move toward 602.31.
#FB M5
Double Bottom
The Double Bottom pattern has been formed on #FB M5. Characteristics: the support level 605.16; the resistance level 613.69; the width of the pattern 853 points. If the resistance level is broken, a change in the trend can be predicted with the first target point lying at the distance of 893 points.
#FB H1
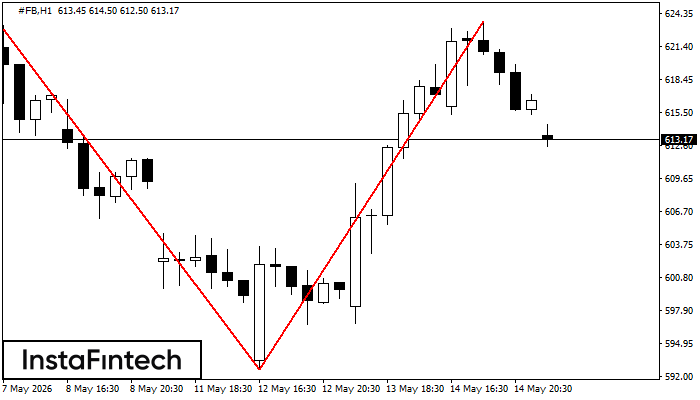
Double Top
The Double Top pattern has been formed on #FB H1. It signals that the trend has been changed from upwards to downwards. Probably, if the base of the pattern 592.63 is broken, the downward movement will continue.