 English
  Русский
 Bahasa Indonesia
 Bahasa Malay
 ไทย
ไทย Español
 Deutsch
 Български
 Français
 Tiếng Việt
 中文
中文 বাংলা
বাংলা हिन्दी
 Čeština
 Українська
 Română
FX.co ★ Patterns GBPAUD | British Pound (GBP) to Australian Dollar (AUD) Rate in the Forex market

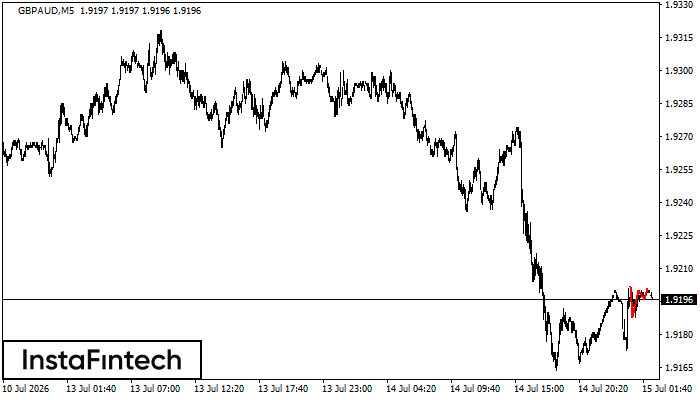
GBPAUD M5
Triple Top
The Triple Top pattern has formed on the chart of the GBPAUD M5 trading instrument. It is a reversal pattern featuring the following characteristics: resistance level 1, support level -8, and pattern’s width 14. Forecast If the price breaks through the support level 1.9188, it is likely to move further down to 1.9185.
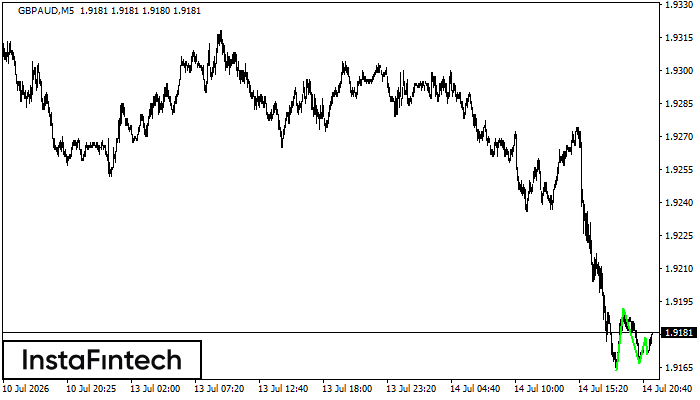
GBPAUD M5
Triple Bottom
The Triple Bottom pattern has been formed on GBPAUD M5. It has the following characteristics: resistance level 1.9192/1.9179; support level 1.9164/1.9171; the width is 28 points. In the event of a breakdown of the resistance level of 1.9192, the price is likely to continue an upward movement at least to 1.9182.
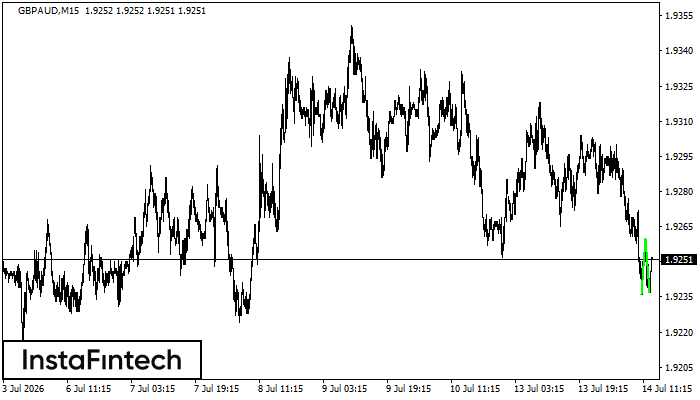
GBPAUD M15
Double Bottom
The Double Bottom pattern has been formed on GBPAUD M15. Characteristics: the support level 1.9236; the resistance level 1.9260; the width of the pattern 24 points. If the resistance level is broken, a change in the trend can be predicted with the first target point lying at the distance of 23 points.
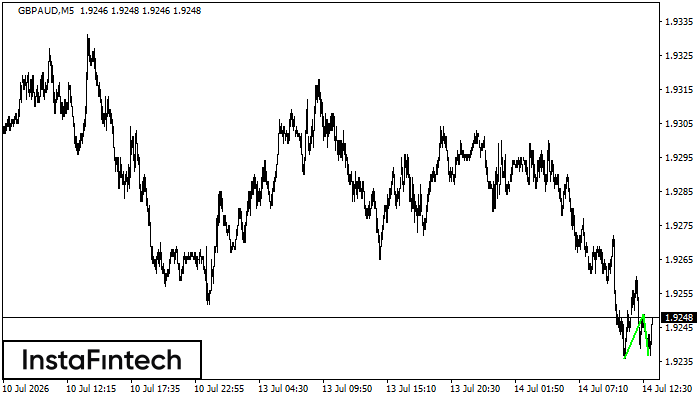
GBPAUD M5
Double Bottom
The Double Bottom pattern has been formed on GBPAUD M5. This formation signals a reversal of the trend from downwards to upwards. The signal is that a buy trade should be opened after the upper boundary of the pattern 1.9249 is broken. The further movements will rely on the width of the current pattern 13 points.
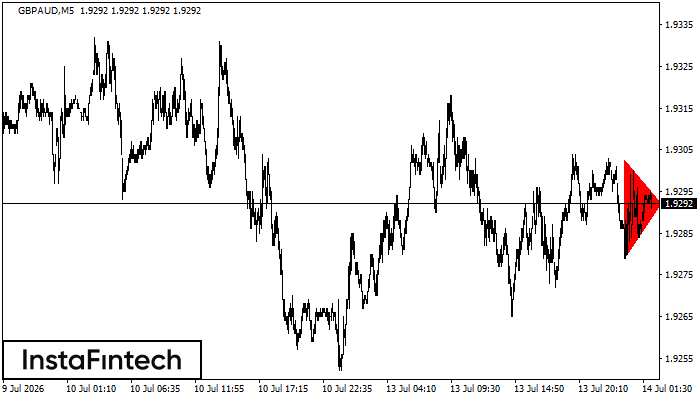
GBPAUD M5
Bearish Symmetrical Triangle
According to the chart of M5, GBPAUD formed the Bearish Symmetrical Triangle pattern. Trading recommendations: A breach of the lower border 1.9279 is likely to encourage a continuation of the downward trend.
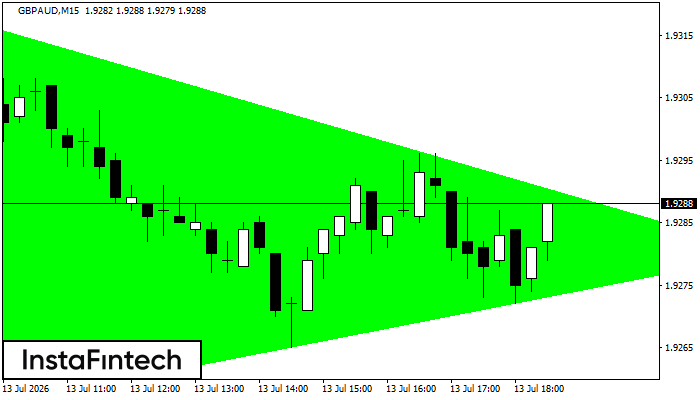
GBPAUD M15
Bullish Symmetrical Triangle
According to the chart of M15, GBPAUD formed the Bullish Symmetrical Triangle pattern. The lower border of the pattern touches the coordinates 1.9255/1.9280 whereas the upper border goes across 1.9318/1.9280. If the Bullish Symmetrical Triangle pattern is in progress, this evidently signals a further upward trend. In other words, in case the scenario comes true, the price of GBPAUD will breach the upper border to head for 1.9303.
GBPAUD M5
Bullish Symmetrical Triangle
According to the chart of M5, GBPAUD formed the Bullish Symmetrical Triangle pattern. The lower border of the pattern touches the coordinates 1.9264/1.9274 whereas the upper border goes across 1.9285/1.9274. If the Bullish Symmetrical Triangle pattern is in progress, this evidently signals a further upward trend. In other words, in case the scenario comes true, the price of GBPAUD will breach the upper border to head for 1.9289.
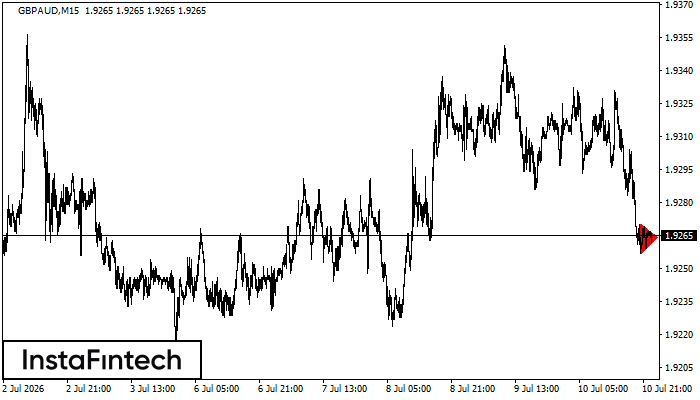
GBPAUD M15
Bearish Symmetrical Triangle
According to the chart of M15, GBPAUD formed the Bearish Symmetrical Triangle pattern. This pattern signals a further downward trend in case the lower border 1.9257 is breached. Here, a hypothetical profit will equal the width of the available pattern that is -14 pips.
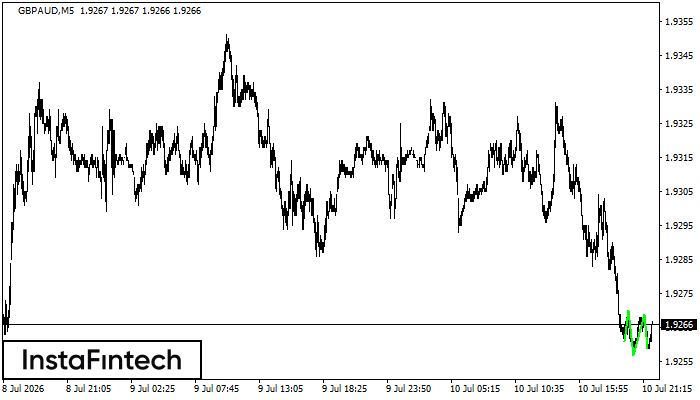
GBPAUD M5
Triple Bottom
The Triple Bottom pattern has been formed on GBPAUD M5. It has the following characteristics: resistance level 1.9270/1.9269; support level 1.9261/1.9259; the width is 9 points. In the event of a breakdown of the resistance level of 1.9270, the price is likely to continue an upward movement at least to 1.9272.
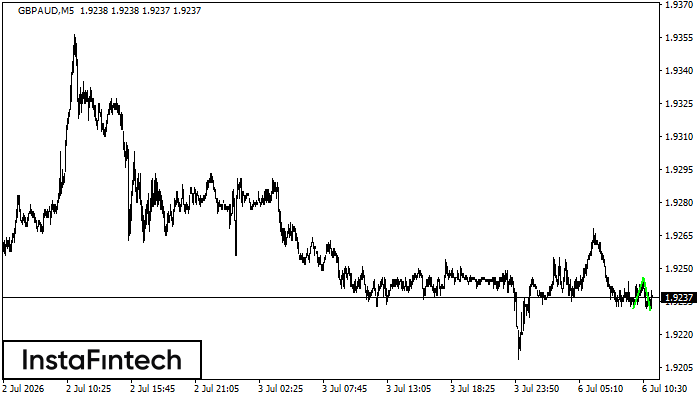
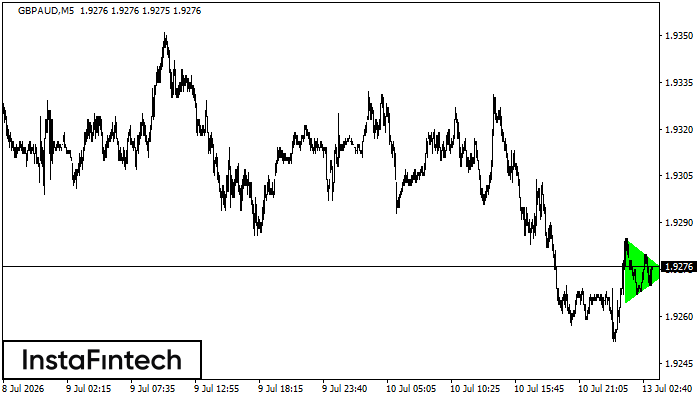
GBPAUD M5
Double Bottom
The Double Bottom pattern has been formed on GBPAUD M5. This formation signals a reversal of the trend from downwards to upwards. The signal is that a buy trade should be opened after the upper boundary of the pattern 1.9246 is broken. The further movements will rely on the width of the current pattern 14 points.