 English
  Русский
 Bahasa Indonesia
 Bahasa Malay
 ไทย
ไทย Español
 Deutsch
 Български
 Français
 Tiếng Việt
 中文
中文 বাংলা
বাংলা हिन्दी
 Čeština
 Українська
 Română
FX.co ★ Patterns GBPJPY | British Pound (GBP) to Japanese Yen (JPY) Rate in the Forex market

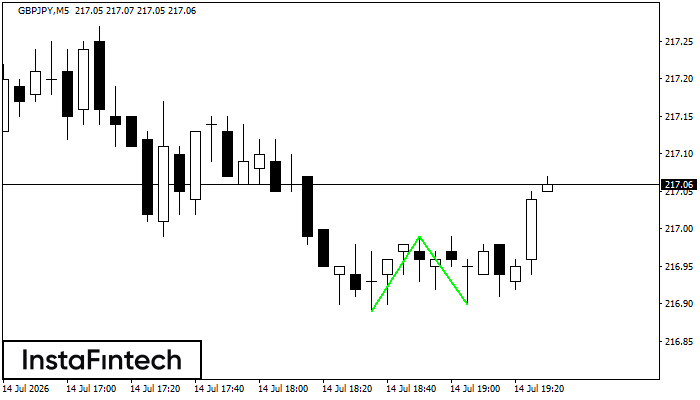
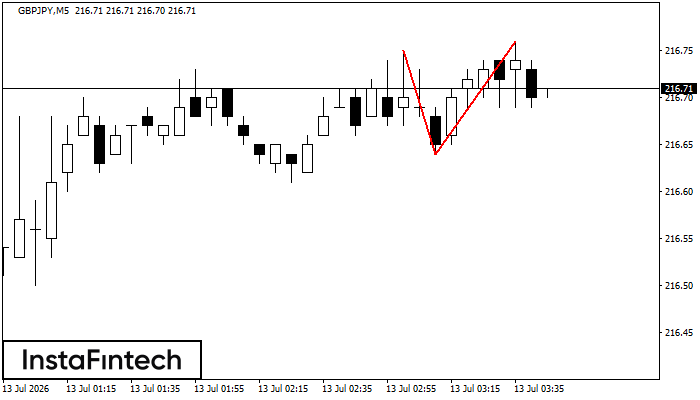
GBPJPY M5
Double Bottom
The Double Bottom pattern has been formed on GBPJPY M5. Characteristics: the support level 216.89; the resistance level 216.99; the width of the pattern 10 points. If the resistance level is broken, a change in the trend can be predicted with the first target point lying at the distance of 9 points.
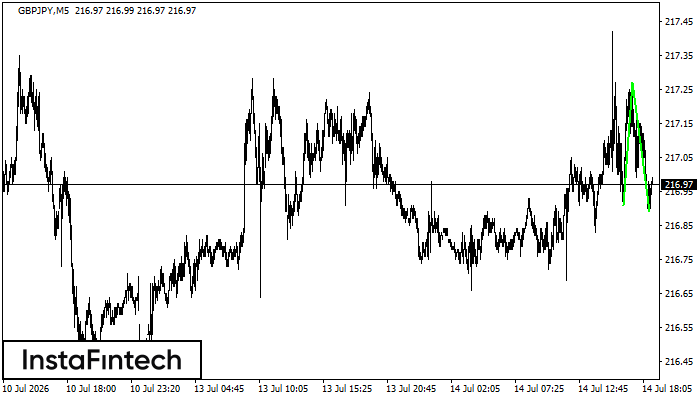
GBPJPY M5
Double Bottom
The Double Bottom pattern has been formed on GBPJPY M5; the upper boundary is 217.27; the lower boundary is 216.89. The width of the pattern is 36 points. In case of a break of the upper boundary 217.27, a change in the trend can be predicted where the width of the pattern will coincide with the distance to a possible take profit level.
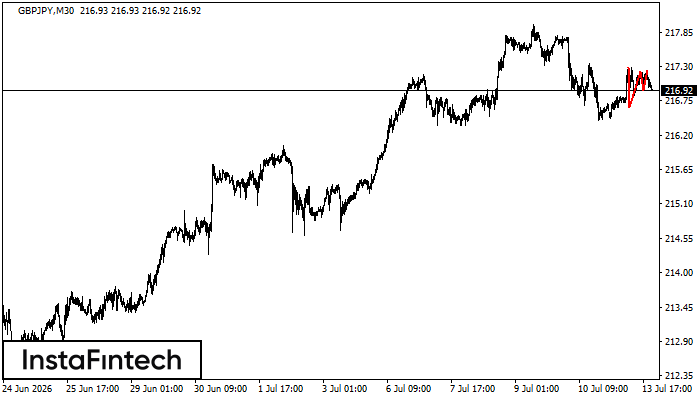
GBPJPY M30
Triple Top
The Triple Top pattern has formed on the chart of the GBPJPY M30. Features of the pattern: borders have an ascending angle; the lower line of the pattern has the coordinates 216.64/216.91 with the upper limit 217.28/217.24; the projection of the width is 64 points. The formation of the Triple Top figure most likely indicates a change in the trend from upward to downward. This means that in the event of a breakdown of the support level of 216.64, the price is most likely to continue the downward movement.
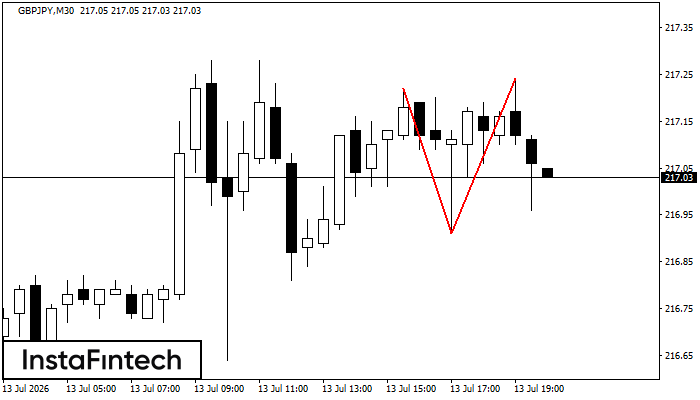
GBPJPY M30
Double Top
The Double Top reversal pattern has been formed on GBPJPY M30. Characteristics: the upper boundary 217.22; the lower boundary 216.91; the width of the pattern is 33 points. Sell trades are better to be opened below the lower boundary 216.91 with a possible movements towards the 216.61 level.
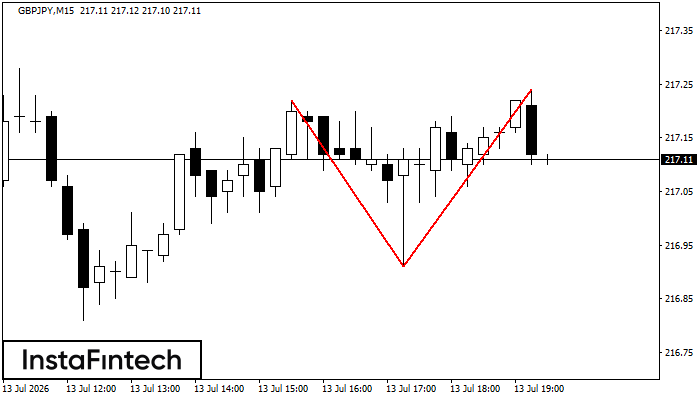
GBPJPY M15
Double Top
The Double Top reversal pattern has been formed on GBPJPY M15. Characteristics: the upper boundary 217.22; the lower boundary 216.91; the width of the pattern is 33 points. Sell trades are better to be opened below the lower boundary 216.91 with a possible movements towards the 216.68 level.
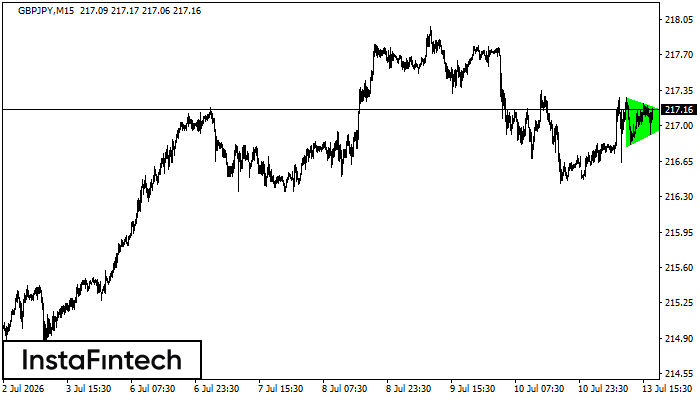
GBPJPY M15
Bullish Symmetrical Triangle
According to the chart of M15, GBPJPY formed the Bullish Symmetrical Triangle pattern. Description: This is the pattern of a trend continuation. 217.28 and 216.79 are the coordinates of the upper and lower borders respectively. The pattern width is measured on the chart at 49 pips. Outlook: If the upper border 217.28 is broken, the price is likely to continue its move by 217.30.
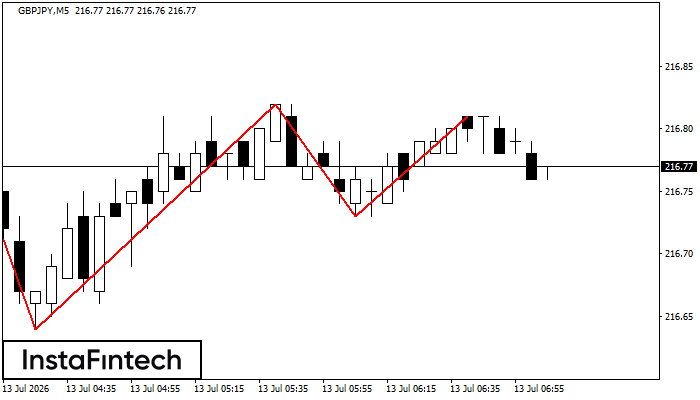
GBPJPY M5
Triple Top
The Triple Top pattern has formed on the chart of the GBPJPY M5. Features of the pattern: borders have an ascending angle; the lower line of the pattern has the coordinates 216.64/216.73 with the upper limit 216.82/216.81; the projection of the width is 18 points. The formation of the Triple Top figure most likely indicates a change in the trend from upward to downward. This means that in the event of a breakdown of the support level of 216.64, the price is most likely to continue the downward movement.
GBPJPY M5
Double Top
The Double Top reversal pattern has been formed on GBPJPY M5. Characteristics: the upper boundary 216.75; the lower boundary 216.64; the width of the pattern is 12 points. Sell trades are better to be opened below the lower boundary 216.64 with a possible movements towards the 216.49 level.
GBPJPY M5
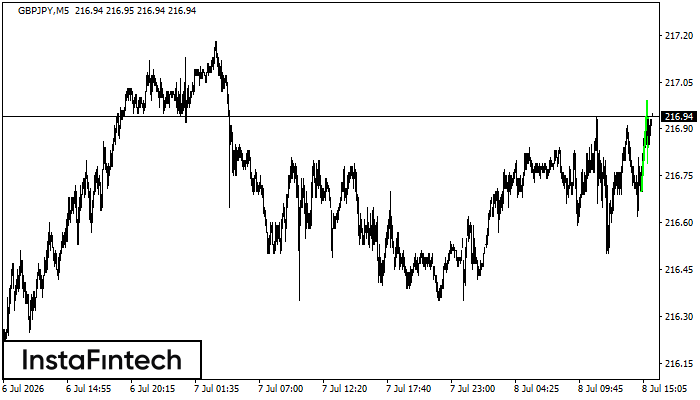
Bullish pennant
The Bullish pennant pattern is formed on the GBPJPY M5 chart. It is a type of the continuation pattern. Supposedly, in case the price is fixed above the pennant’s high of 216.99, a further uptrend is possible.
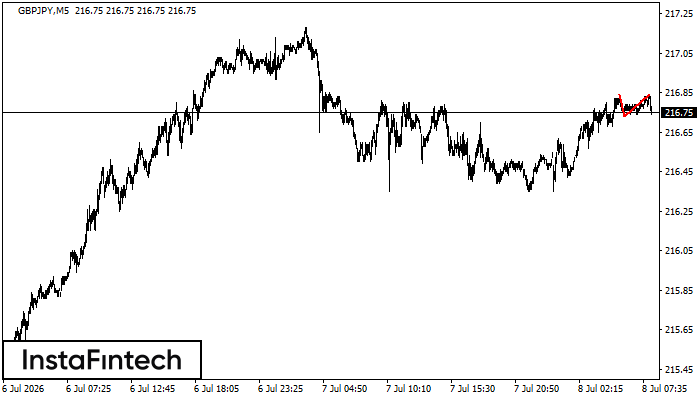
GBPJPY M5
Double Top
The Double Top pattern has been formed on GBPJPY M5. It signals that the trend has been changed from upwards to downwards. Probably, if the base of the pattern 216.73 is broken, the downward movement will continue.