 English
  Русский
 Bahasa Indonesia
 Bahasa Malay
 ไทย
ไทย Español
 Deutsch
 Български
 Français
 Tiếng Việt
 中文
中文 বাংলা
বাংলা हिन्दी
 Čeština
 Українська
 Română
FX.co ★ Patterns GBPUSD | British Pound (GBP) to US Dollar (USD) Rate in the Forex market


GBPUSD M15
Inverse Head and Shoulder
According to the chart of M15, GBPUSD formed the Inverse Head and Shoulder pattern. The Head’s top is set at 1.3386 while the median line of the Neck is found at 1.3365/1.3378. The formation of the Inverse Head and Shoulder pattern evidently signals a reversal of the downward trend. In other words, in case the scenario comes true, the price of GBPUSD will go towards 1.3408

GBPUSD M5
Bearish Symmetrical Triangle
According to the chart of M5, GBPUSD formed the Bearish Symmetrical Triangle pattern. Trading recommendations: A breach of the lower border 1.3359 is likely to encourage a continuation of the downward trend.

GBPUSD M15
Double Bottom
The Double Bottom pattern has been formed on GBPUSD M15; the upper boundary is 1.3422; the lower boundary is 1.3412. The width of the pattern is 9 points. In case of a break of the upper boundary 1.3422, a change in the trend can be predicted where the width of the pattern will coincide with the distance to a possible take profit level.

GBPUSD M5
Double Bottom
The Double Bottom pattern has been formed on GBPUSD M5; the upper boundary is 1.3422; the lower boundary is 1.3412. The width of the pattern is 9 points. In case of a break of the upper boundary 1.3422, a change in the trend can be predicted where the width of the pattern will coincide with the distance to a possible take profit level.

GBPUSD M5
Triple Bottom
The Triple Bottom pattern has formed on the chart of the GBPUSD M5 trading instrument. The pattern signals a change in the trend from downwards to upwards in the case of breakdown of 1.3457/1.3455.

GBPUSD M5
Bearish pennant
The Bearish pennant pattern has formed on the GBPUSD M5 chart. This pattern type is characterized by a slight slowdown after which the price will move in the direction of the original trend. In case the price fixes below the pattern’s low of 1.3438, a trader will be able to successfully enter the sell position.
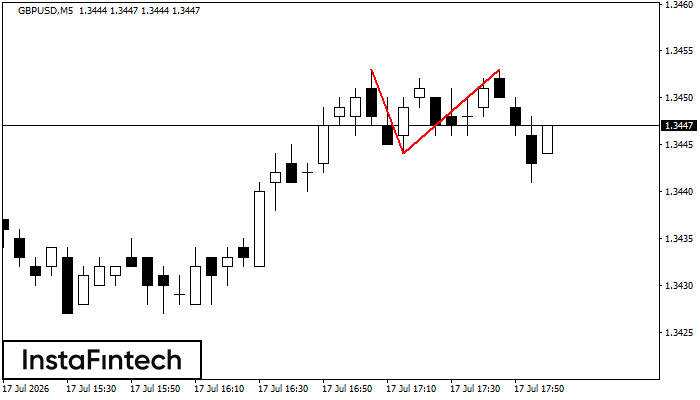
GBPUSD M5
Double Top
The Double Top reversal pattern has been formed on GBPUSD M5. Characteristics: the upper boundary 1.3453; the lower boundary 1.3441; the width of the pattern is 12 points. Sell trades are better to be opened below the lower boundary 1.3441 with a possible movements towards the 1.3426 level.
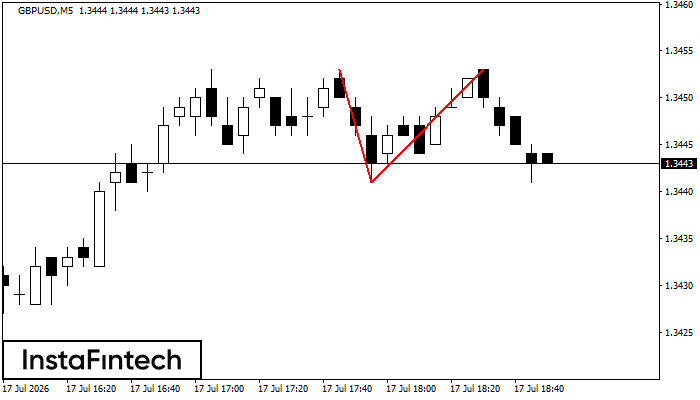
GBPUSD M5
Double Top
The Double Top pattern has been formed on GBPUSD M5. It signals that the trend has been changed from upwards to downwards. Probably, if the base of the pattern 1.3444 is broken, the downward movement will continue.
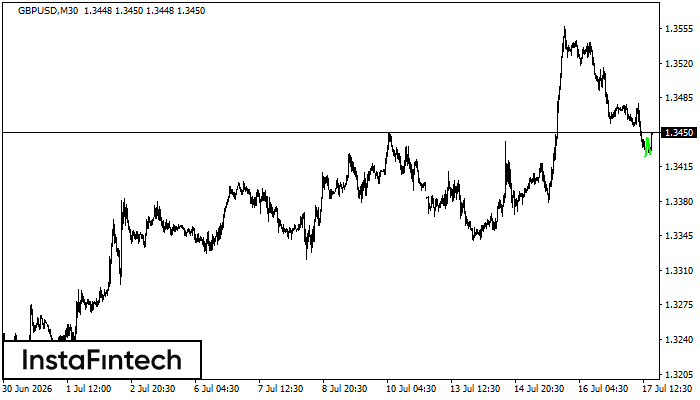
GBPUSD M30
Double Bottom
The Double Bottom pattern has been formed on GBPUSD M30; the upper boundary is 1.3445; the lower boundary is 1.3427. The width of the pattern is 20 points. In case of a break of the upper boundary 1.3445, a change in the trend can be predicted where the width of the pattern will coincide with the distance to a possible take profit level.
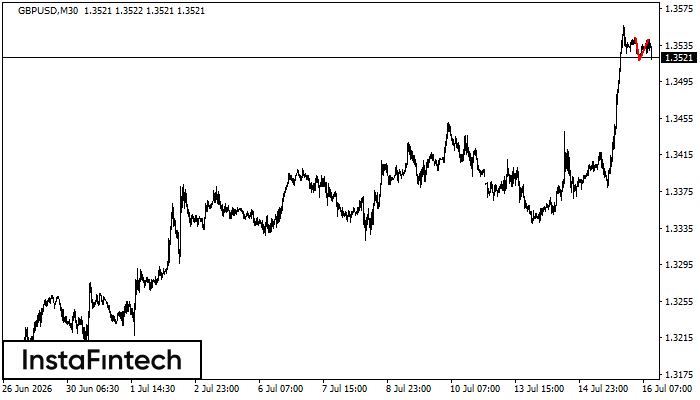
GBPUSD M30
Double Top
On the chart of GBPUSD M30 the Double Top reversal pattern has been formed. Characteristics: the upper boundary 1.3541; the lower boundary 1.3518; the width of the pattern 23 points. The signal: a break of the lower boundary will cause continuation of the downward trend targeting the 1.3488 level.