 English
  Русский
 Bahasa Indonesia
 Bahasa Malay
 ไทย
ไทย Español
 Deutsch
 Български
 Français
 Tiếng Việt
 中文
中文 বাংলা
বাংলা हिन्दी
 Čeština
 Українська
 Română
FX.co ★ Patterns #GOOG | Alphabet Inc. Stock Price

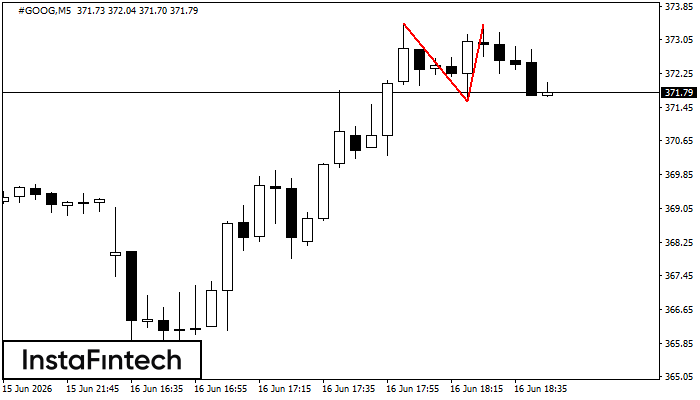
#GOOG M5
Double Top
The Double Top pattern has been formed on #GOOG M5. It signals that the trend has been changed from upwards to downwards. Probably, if the base of the pattern 371.59 is broken, the downward movement will continue.
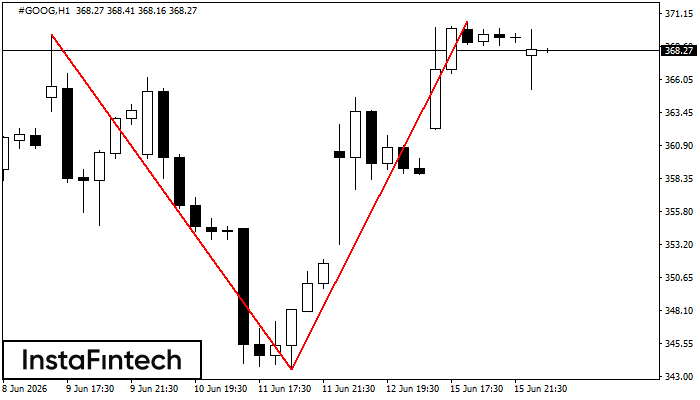
#GOOG H1
Double Top
The Double Top pattern has been formed on #GOOG H1. It signals that the trend has been changed from upwards to downwards. Probably, if the base of the pattern 343.54 is broken, the downward movement will continue.
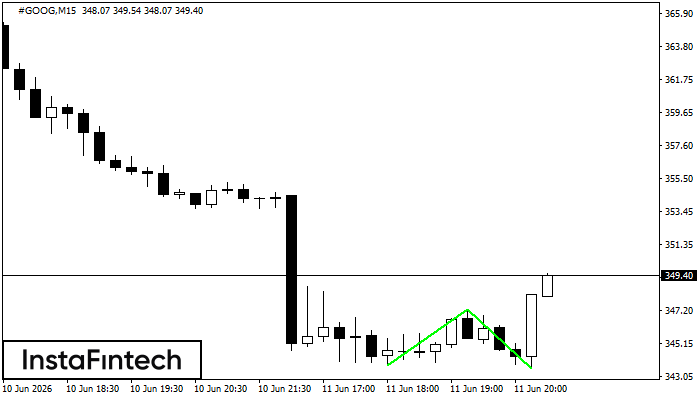
#GOOG M15
Double Bottom
The Double Bottom pattern has been formed on #GOOG M15. This formation signals a reversal of the trend from downwards to upwards. The signal is that a buy trade should be opened after the upper boundary of the pattern 347.29 is broken. The further movements will rely on the width of the current pattern 353 points.
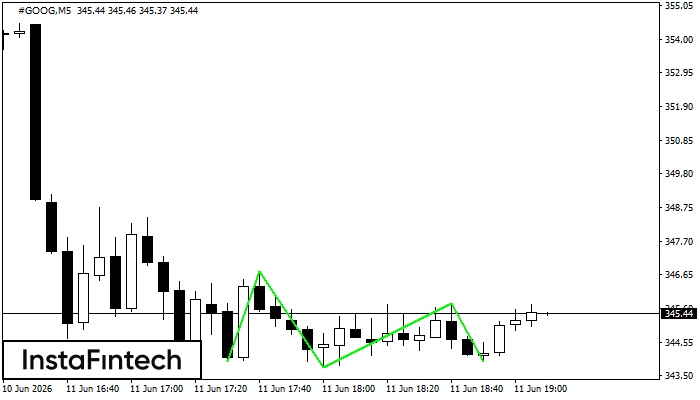
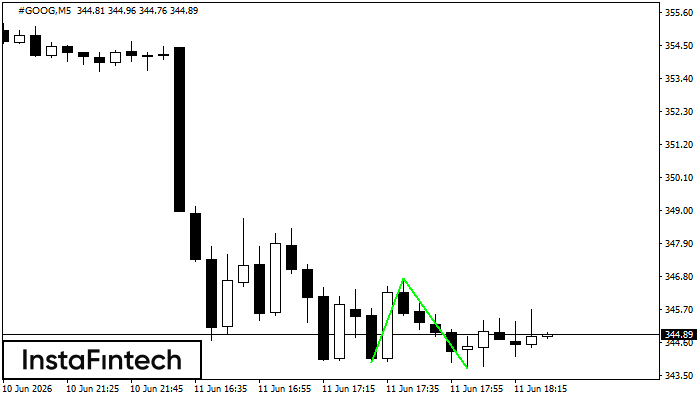
#GOOG M5
Triple Bottom
The Triple Bottom pattern has been formed on #GOOG M5. It has the following characteristics: resistance level 346.75/345.77; support level 343.95/343.95; the width is 280 points. In the event of a breakdown of the resistance level of 346.75, the price is likely to continue an upward movement at least to 343.91.
#GOOG M5
Double Bottom
The Double Bottom pattern has been formed on #GOOG M5. This formation signals a reversal of the trend from downwards to upwards. The signal is that a buy trade should be opened after the upper boundary of the pattern 346.75 is broken. The further movements will rely on the width of the current pattern 280 points.
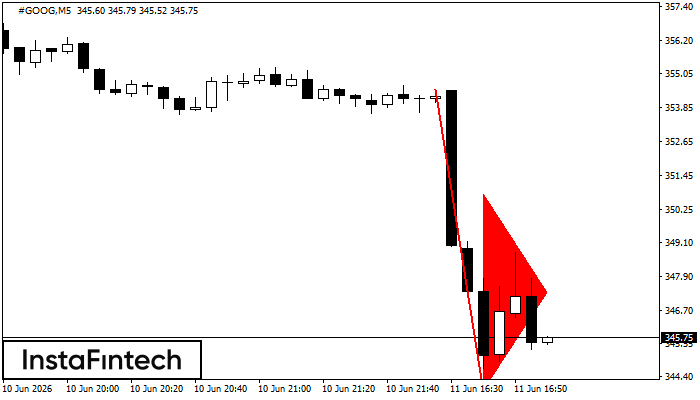
#GOOG M5
Bearish pennant
The Bearish pennant pattern has formed on the #GOOG M5 chart. The pattern signals continuation of the downtrend in case the pennant’s low of 343.89 is broken through. Recommendations: Place the sell stop pending order 10 pips below the pattern’s low. Place the take profit order at the projection distance of the flagpole height.
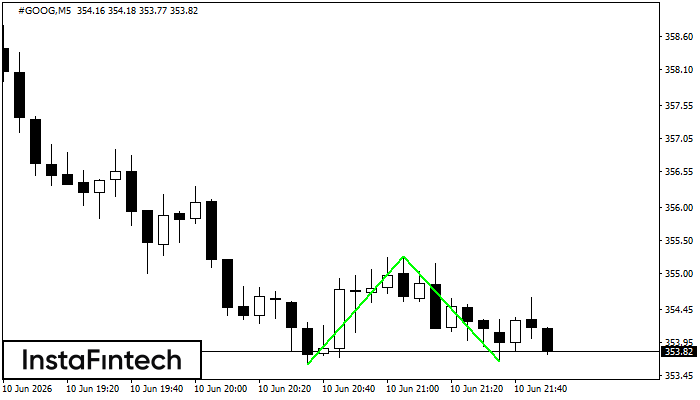
#GOOG M5
Double Bottom
The Double Bottom pattern has been formed on #GOOG M5. This formation signals a reversal of the trend from downwards to upwards. The signal is that a buy trade should be opened after the upper boundary of the pattern 355.26 is broken. The further movements will rely on the width of the current pattern 164 points.
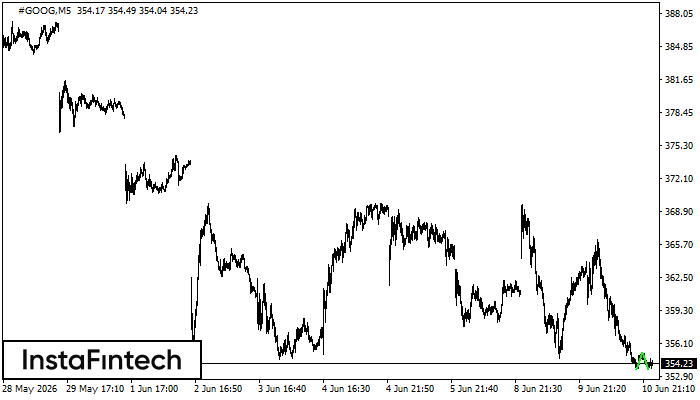
#GOOG M5
Double Bottom
The Double Bottom pattern has been formed on #GOOG M5. Characteristics: the support level 353.62; the resistance level 355.26; the width of the pattern 164 points. If the resistance level is broken, a change in the trend can be predicted with the first target point lying at the distance of 160 points.
#GOOG M5
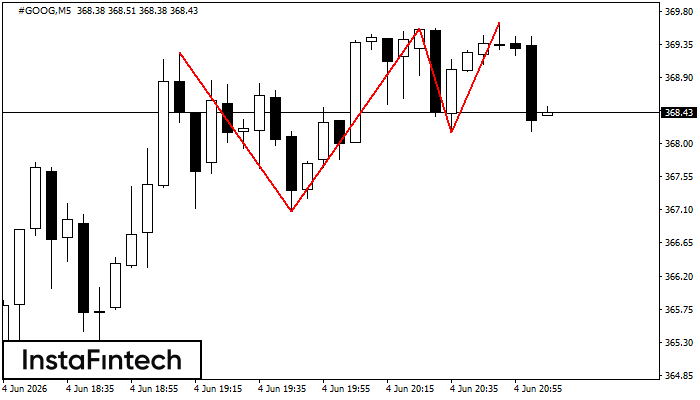
Double Top
On the chart of #GOOG M5 the Double Top reversal pattern has been formed. Characteristics: the upper boundary 369.73; the lower boundary 367.67; the width of the pattern 206 points. The signal: a break of the lower boundary will cause continuation of the downward trend targeting the 367.52 level.
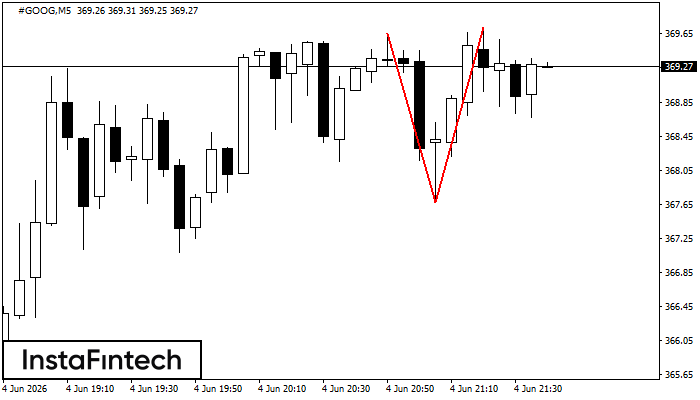
#GOOG M5
Triple Top
The Triple Top pattern has formed on the chart of the #GOOG M5 trading instrument. It is a reversal pattern featuring the following characteristics: resistance level -41, support level -107, and pattern’s width 216. Forecast If the price breaks through the support level 367.08, it is likely to move further down to 369.41.