 English
  Русский
 Bahasa Indonesia
 Bahasa Malay
 ไทย
ไทย Español
 Deutsch
 Български
 Français
 Tiếng Việt
 中文
中文 বাংলা
বাংলা हिन्दी
 Čeština
 Українська
 Română
FX.co ★ Patterns #NTDOY | Nintendo Co., Ltd. Stock Price

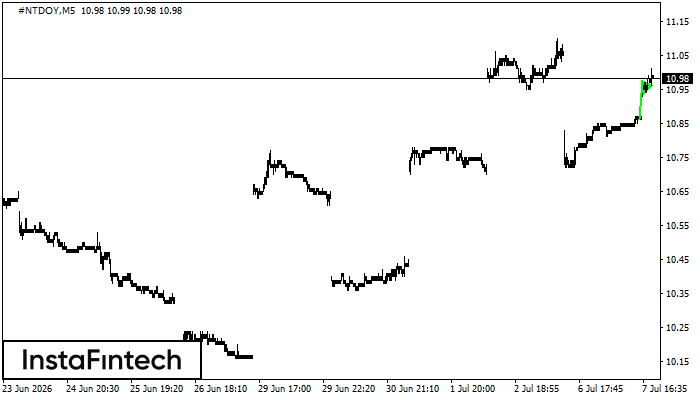
#NTDOY M5
Bullish pennant
The Bullish pennant graphic pattern has formed on the #NTDOY M5 instrument. This pattern type falls under the category of continuation patterns. In this case, if the quote can breaks out high, is expected to continue the upward trend to level 11.13.
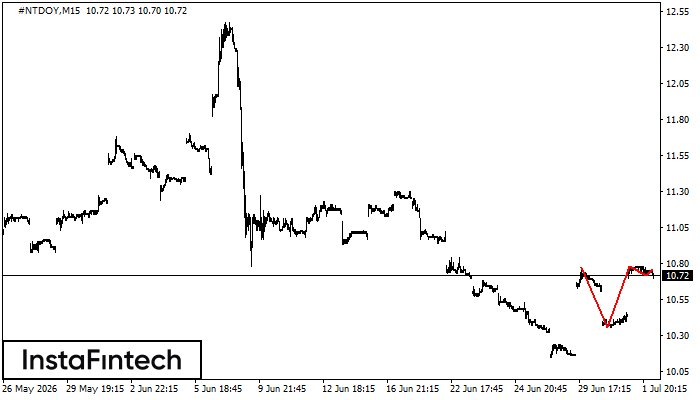
#NTDOY M15
Triple Top
On the chart of the #NTDOY M15 trading instrument, the Triple Top pattern that signals a trend change has formed. It is possible that after formation of the third peak, the price will try to break through the resistance level 10.36, where we advise to open a trading position for sale. Take profit is the projection of the pattern’s width, which is 41 points.
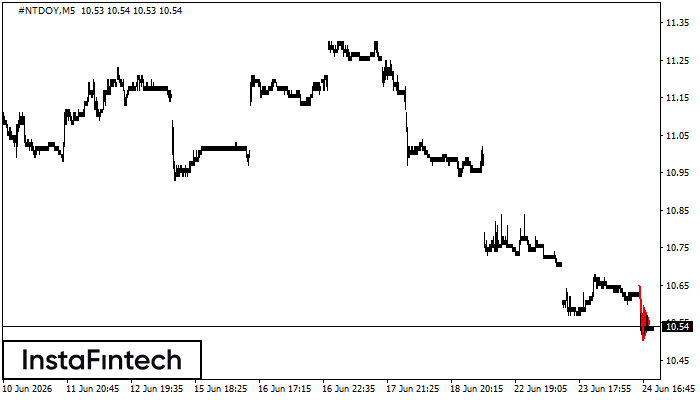
#NTDOY M5
Bearish pennant
The Bearish pennant pattern has formed on the #NTDOY M5 chart. The pattern signals continuation of the downtrend in case the pennant’s low of 10.50 is broken through. Recommendations: Place the sell stop pending order 10 pips below the pattern’s low. Place the take profit order at the projection distance of the flagpole height.
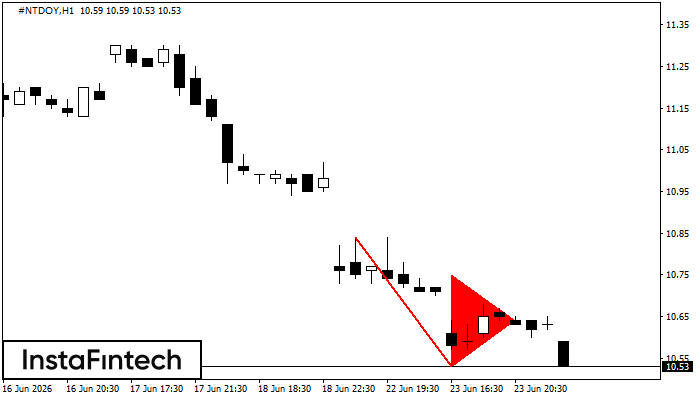
#NTDOY H1
Bearish pennant
The Bearish pennant pattern has formed on the #NTDOY H1 chart. It signals potential continuation of the existing trend. Specifications: the pattern’s bottom has the coordinate of 10.53; the projection of the flagpole height is equal to 31 pips. In case the price breaks out the pattern’s bottom of 10.53, the downtrend is expected to continue for further level 10.13.
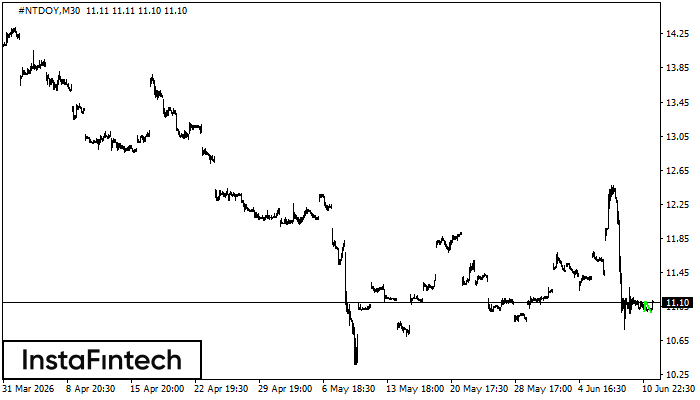
#NTDOY M30
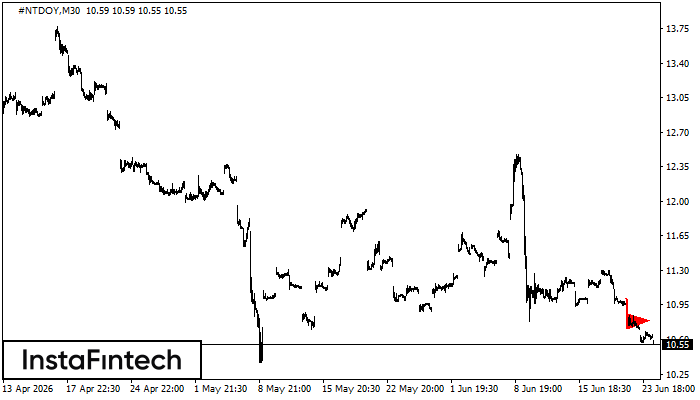
Bearish pennant
The Bearish pennant pattern has formed on the #NTDOY M30 chart. It signals potential continuation of the existing trend. Specifications: the pattern’s bottom has the coordinate of 10.71; the projection of the flagpole height is equal to 31 pips. In case the price breaks out the pattern’s bottom of 10.71, the downtrend is expected to continue for further level 10.41.
#NTDOY M15
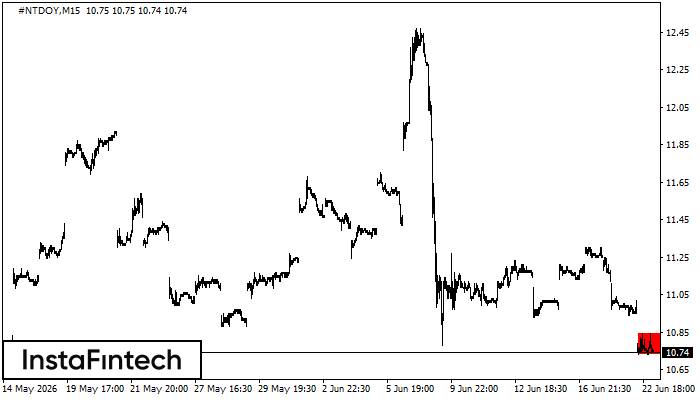
Bearish Rectangle
According to the chart of M15, #NTDOY formed the Bearish Rectangle. The pattern indicates a trend continuation. The upper border is 10.84, the lower border is 10.73. The signal means that a short position should be opened after fixing a price below the lower border 10.73 of the Bearish Rectangle.
#NTDOY M5
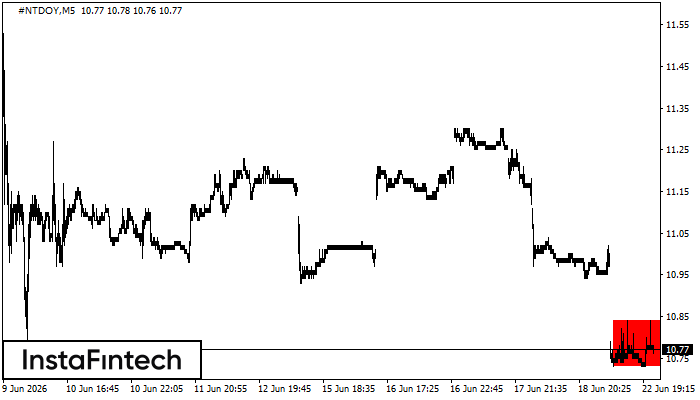
Bearish Rectangle
According to the chart of M5, #NTDOY formed the Bearish Rectangle. The pattern indicates a trend continuation. The upper border is 10.84, the lower border is 10.73. The signal means that a short position should be opened after fixing a price below the lower border 10.73 of the Bearish Rectangle.
#NTDOY H1
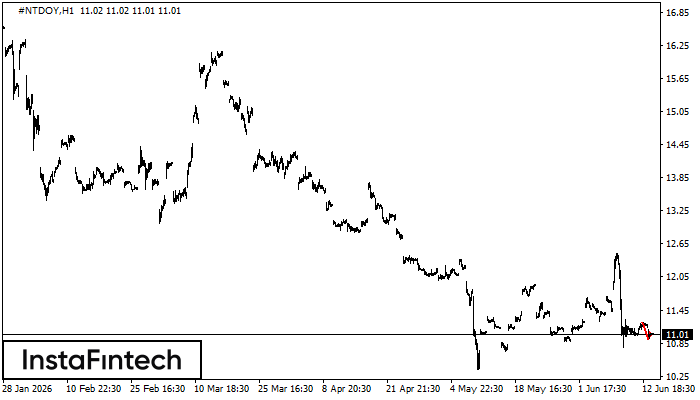
Bearish pennant
The Bearish pennant pattern has formed on the #NTDOY H1 chart. The pattern signals continuation of the downtrend in case the pennant’s low of 10.92 is broken through. Recommendations: Place the sell stop pending order 10 pips below the pattern’s low. Place the take profit order at the projection distance of the flagpole height.
#NTDOY M30
Double Bottom
The Double Bottom pattern has been formed on #NTDOY M30; the upper boundary is 11.11; the lower boundary is 10.98. The width of the pattern is 12 points. In case of a break of the upper boundary 11.11, a change in the trend can be predicted where the width of the pattern will coincide with the distance to a possible take profit level.
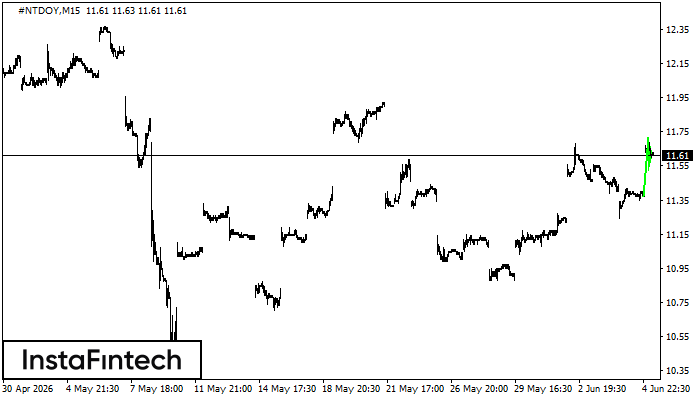
#NTDOY M15
Bullish pennant
The Bullish pennant pattern is formed on the #NTDOY M15 chart. It is a type of the continuation pattern. Supposedly, in case the price is fixed above the pennant’s high of 11.72, a further uptrend is possible.