 English
  Русский
 Bahasa Indonesia
 Bahasa Malay
 ไทย
ไทย Español
 Deutsch
 Български
 Français
 Tiếng Việt
 中文
中文 বাংলা
বাংলা हिन्दी
 Čeština
 Українська
 Română
FX.co ★ Patterns NZDUSD | New Zealand Dollar (NZD) to US Dollar (USD) Rate in the Forex market

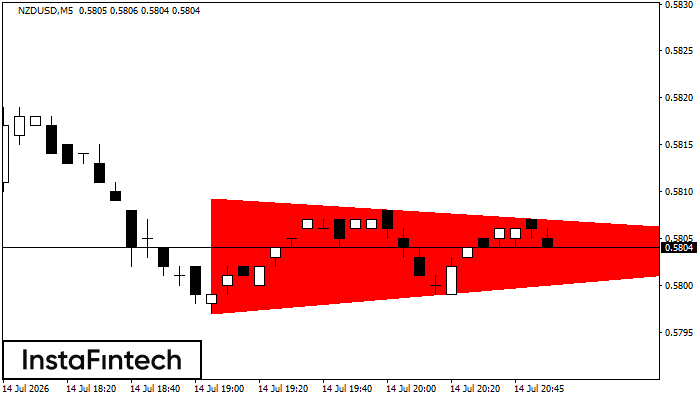
NZDUSD M5
Bearish Symmetrical Triangle
According to the chart of M5, NZDUSD formed the Bearish Symmetrical Triangle pattern. Description: The lower border is 0.5797/0.5804 and upper border is 0.5809/0.5804. The pattern width is measured on the chart at -12 pips. The formation of the Bearish Symmetrical Triangle pattern evidently signals a continuation of the downward trend. In other words, if the scenario comes true and NZDUSD breaches the lower border, the price could continue its move toward 0.5789.
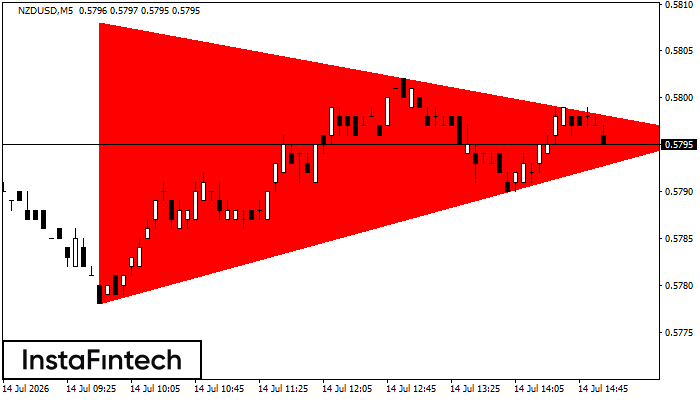
NZDUSD M5
Bearish Symmetrical Triangle
According to the chart of M5, NZDUSD formed the Bearish Symmetrical Triangle pattern. This pattern signals a further downward trend in case the lower border 0.5778 is breached. Here, a hypothetical profit will equal the width of the available pattern that is -30 pips.
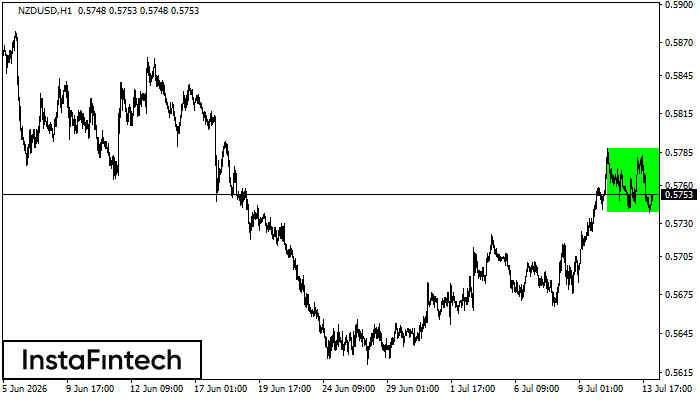
NZDUSD H1
Bullish Rectangle
According to the chart of H1, NZDUSD formed the Bullish Rectangle. The pattern indicates a trend continuation. The upper border is 0.5788, the lower border is 0.5739. The signal means that a long position should be opened above the upper border 0.5788 of the Bullish Rectangle.
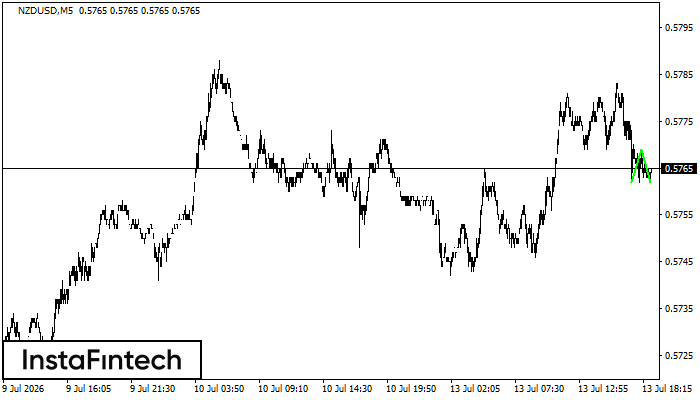
NZDUSD M5
Double Bottom
The Double Bottom pattern has been formed on NZDUSD M5. This formation signals a reversal of the trend from downwards to upwards. The signal is that a buy trade should be opened after the upper boundary of the pattern 0.5769 is broken. The further movements will rely on the width of the current pattern 7 points.
NZDUSD M15
Bullish Rectangle
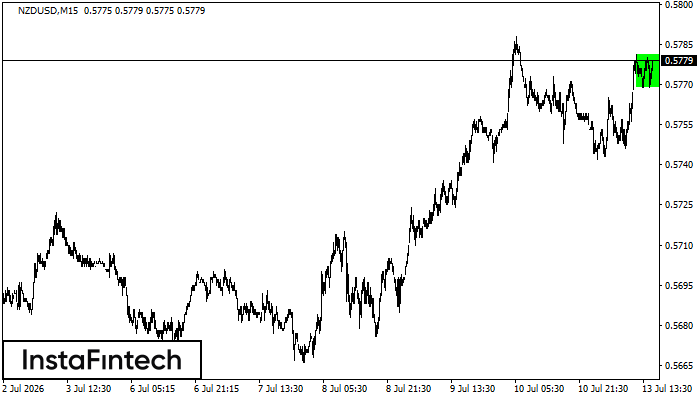
According to the chart of M15, NZDUSD formed the Bullish Rectangle. This type of a pattern indicates a trend continuation. It consists of two levels: resistance 0.5781 and support 0.5769. In case the resistance level 0.5781 - 0.5781 is broken, the instrument is likely to follow the bullish trend.
NZDUSD M5
Bullish pennant
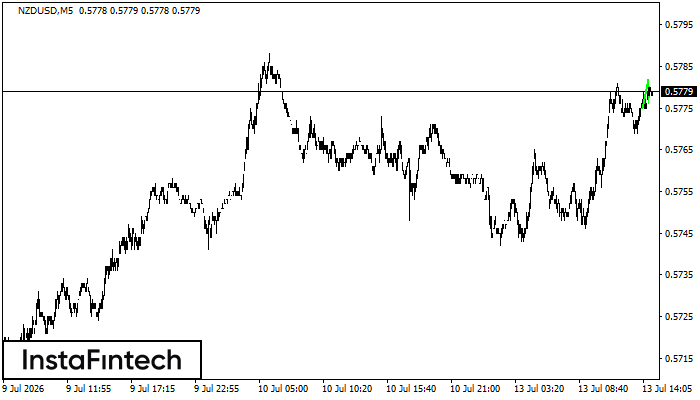
The Bullish pennant pattern is formed on the NZDUSD M5 chart. It is a type of the continuation pattern. Supposedly, in case the price is fixed above the pennant’s high of 0.5782, a further uptrend is possible.
NZDUSD H1
Bullish Symmetrical Triangle
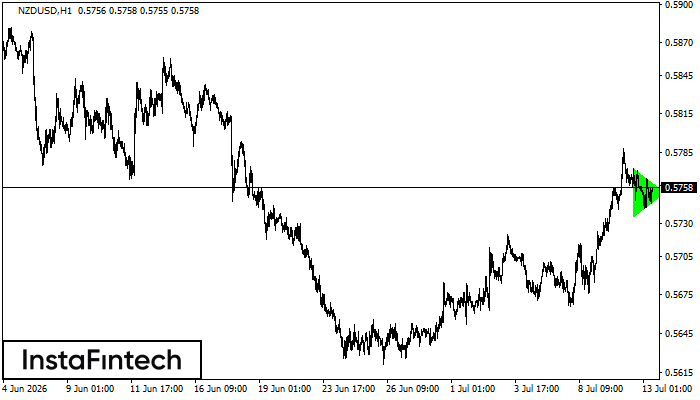
According to the chart of H1, NZDUSD formed the Bullish Symmetrical Triangle pattern, which signals the trend will continue. Description. The upper border of the pattern touches the coordinates 0.5773/0.5754 whereas the lower border goes across 0.5736/0.5754. The pattern width is measured on the chart at 37 pips. If the Bullish Symmetrical Triangle pattern is in progress during the upward trend, this indicates the current trend will go on. In case 0.5754 is broken, the price could continue its move toward 0.5794.
NZDUSD M15
Double Top
The Double Top pattern has been formed on NZDUSD M15. It signals that the trend has been changed from upwards to downwards. Probably, if the base of the pattern 0.5700 is broken, the downward movement will continue.
NZDUSD M5
Bullish Flag
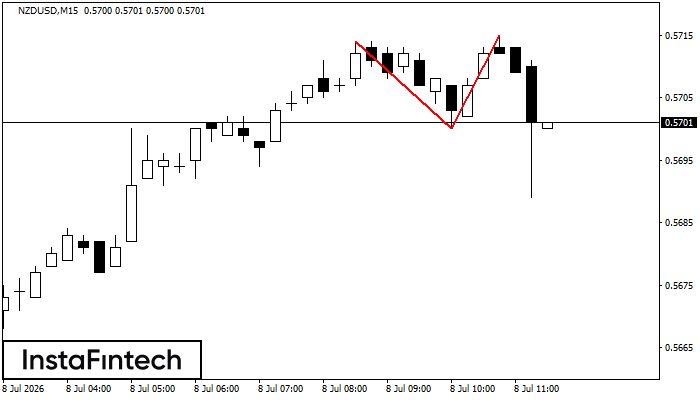
The Bullish Flag pattern has been formed on the chart NZDUSD M5 which signals that the upward trend will continue. Signals: а break of the peak at 0.5716 may push the price higher, and the rise will be the projection of the pole.
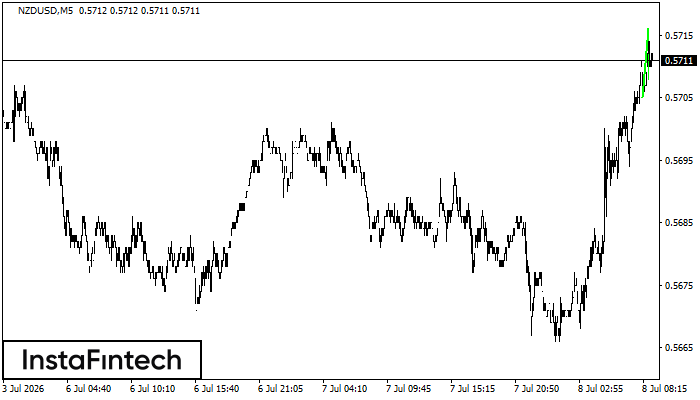
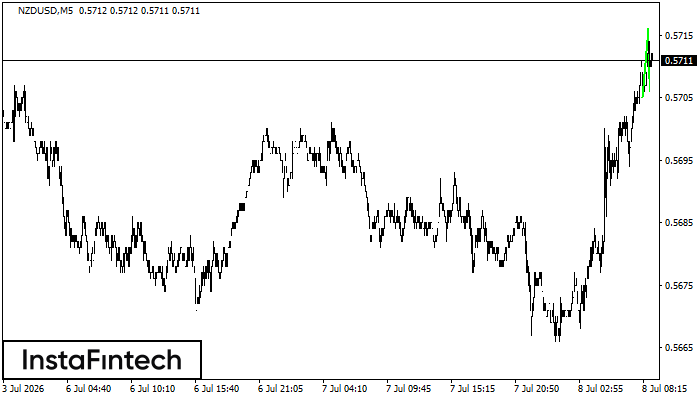
NZDUSD M5
Bullish pennant
The Bullish pennant graphic pattern has formed on the NZDUSD M5 instrument. This pattern type falls under the category of continuation patterns. In this case, if the quote can breaks out high, is expected to continue the upward trend to level 0.5731.