 English
  Русский
 Bahasa Indonesia
 Bahasa Malay
 ไทย
ไทย Español
 Deutsch
 Български
 Français
 Tiếng Việt
 中文
中文 বাংলা
বাংলা हिन्दी
 Čeština
 Українська
 Română
FX.co ★ Patterns #PEP | PepsiCo, Inc. Stock Price

#PEP M5
Double Top
On the chart of #PEP M5 the Double Top reversal pattern has been formed. Characteristics: the upper boundary 149.02; the lower boundary 147.79; the width of the pattern 123 points. The signal: a break of the lower boundary will cause continuation of the downward trend targeting the 147.64 level.
#PEP M5
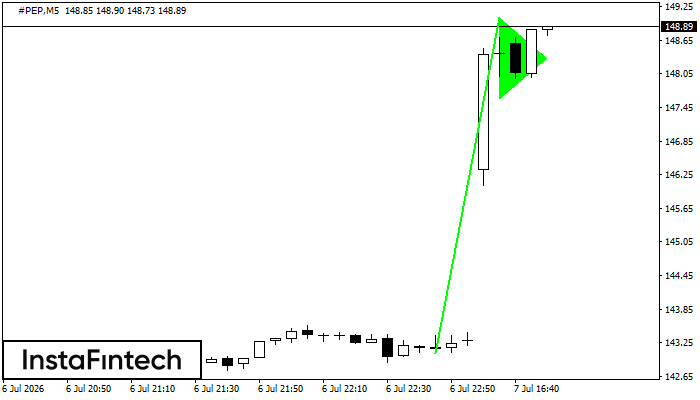
Bullish pennant
The Bullish pennant pattern is formed on the #PEP M5 chart. It is a type of the continuation pattern. Supposedly, in case the price is fixed above the pennant’s high of 149.05, a further uptrend is possible.
#PEP M5
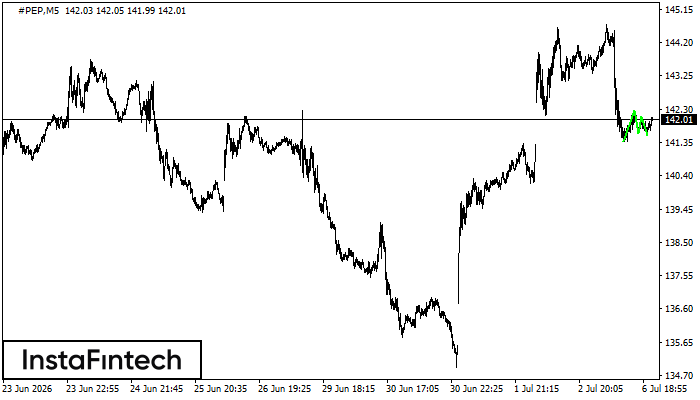
Triple Bottom
The Triple Bottom pattern has been formed on #PEP M5. It has the following characteristics: resistance level 142.25/142.08; support level 141.38/141.54; the width is 87 points. In the event of a breakdown of the resistance level of 142.25, the price is likely to continue an upward movement at least to 141.76.
#PEP M15
Double Top
The Double Top pattern has been formed on #PEP M15. It signals that the trend has been changed from upwards to downwards. Probably, if the base of the pattern 143.09 is broken, the downward movement will continue.
#PEP M5
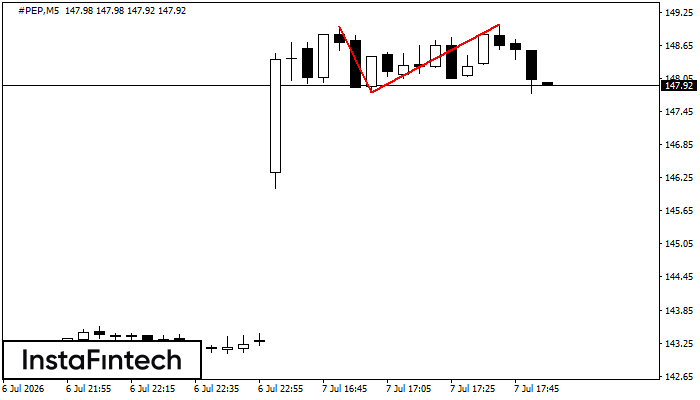
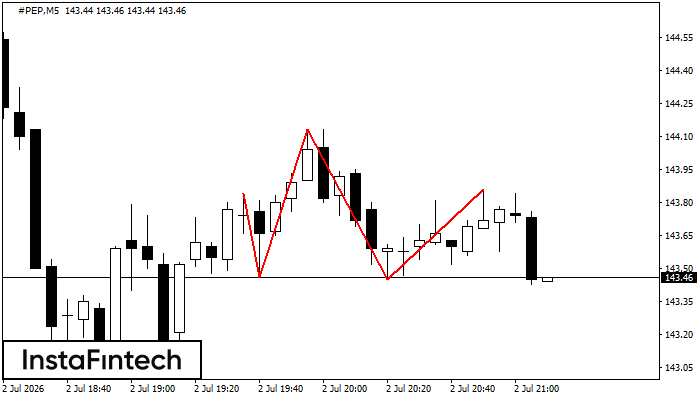
Head and Shoulders
The #PEP M5 formed the Head and Shoulders pattern with the following features: The Head’s top is at 144.13, the Neckline and the upward angle are at 143.46/143.45. The formation of this pattern can bring about changes in the current trend from bullish to bearish. In case the pattern triggers the expected changes, the price of #PEP will go towards 143.30.
#PEP M15
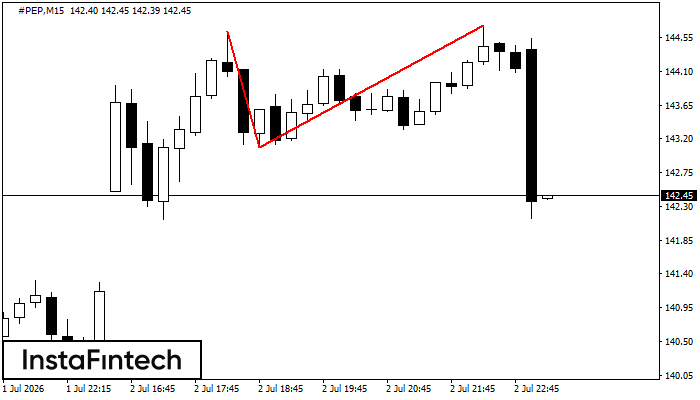
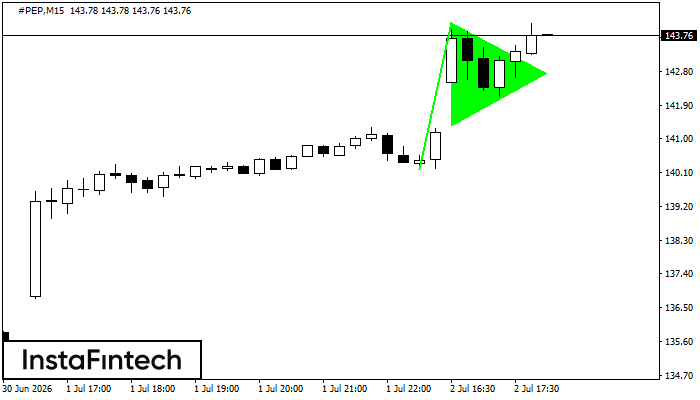
Bullish pennant
The Bullish pennant pattern is formed on the #PEP M15 chart. It is a type of the continuation pattern. Supposedly, in case the price is fixed above the pennant’s high of 144.11, a further uptrend is possible.
#PEP M5
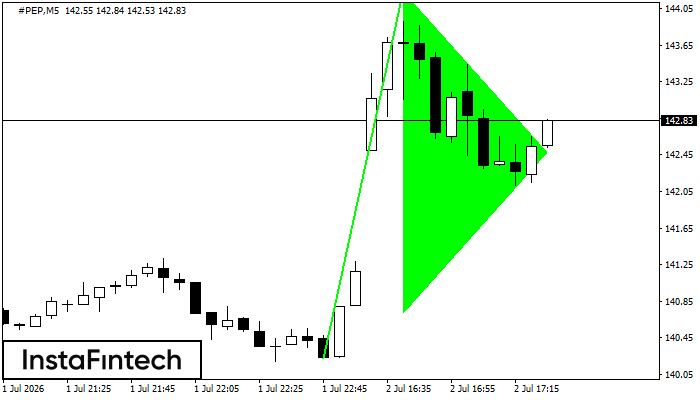
Bullish pennant
The Bullish pennant graphic pattern has formed on the #PEP M5 instrument. This pattern type falls under the category of continuation patterns. In this case, if the quote can breaks out high, is expected to continue the upward trend to level 144.39.
#PEP M5
Double Top
The Double Top pattern has been formed on #PEP M5. It signals that the trend has been changed from upwards to downwards. Probably, if the base of the pattern 139.46 is broken, the downward movement will continue.
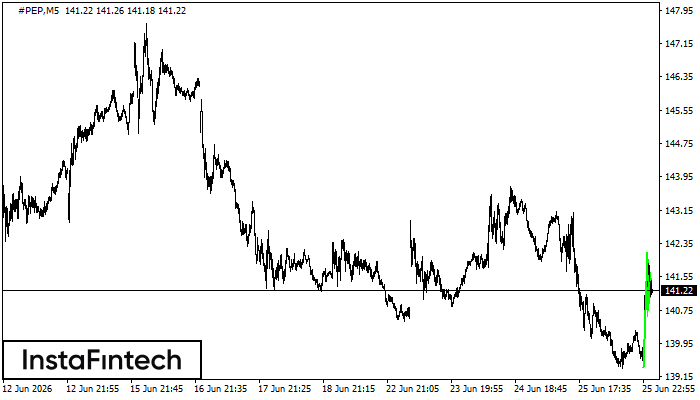
#PEP M5
Bullish pennant
The Bullish pennant pattern is formed on the #PEP M5 chart. It is a type of the continuation pattern. Supposedly, in case the price is fixed above the pennant’s high of 142.14, a further uptrend is possible.
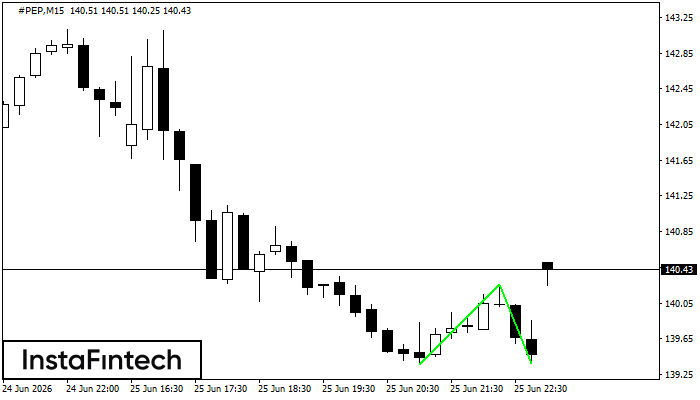
#PEP M15
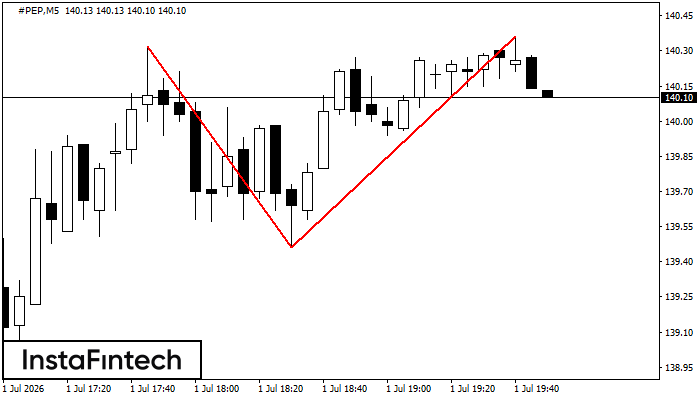
Double Bottom
The Double Bottom pattern has been formed on #PEP M15; the upper boundary is 140.26; the lower boundary is 139.37. The width of the pattern is 90 points. In case of a break of the upper boundary 140.26, a change in the trend can be predicted where the width of the pattern will coincide with the distance to a possible take profit level.