 English
  Русский
 Bahasa Indonesia
 Bahasa Malay
 ไทย
ไทย Español
 Deutsch
 Български
 Français
 Tiếng Việt
 中文
中文 বাংলা
বাংলা हिन्दी
 Čeština
 Українська
 Română
FX.co ★ Analytics #Ripple | Ripple cryptocurrency Rate in the Forex market


Crypto Analysis
Ripple ready for quantum era
Ripple, known for its involvement in digital payments and blockchain technologies, is taking a proactive approach to ensuring the long-term security of its XRP Ledger (XRPL). Aware of the potential...
 Relevance until2026-04-22
Analytical expert:
2026-04-21

Forex Analysis
Weekly Forecast Based on Simplified Wave Analysis for EUR/USD, USD/JPY, GBP/JPY, USD/CAD, Bitcoin, and Ripple – March 30th
In the coming days, we can expect the euro's downward movement to complete, reaching the boundaries of the calculated support zone. In the second half of the week, a reversal...
Relevance until2026-04-03Analytical expert:
2026-03-30

Crypto Analysis
XRP becoming less speculative and more institutional
In the fast-moving world of digital finance, a paradigm shift is underway in how digital assets are used. Representatives of Franklin Templeton, a respected investment firm, said in a recent...
Relevance until2026-03-25Analytical expert:
2026-03-24

Forex Analysis
Weekly Forecast Based on Simplified Wave Analysis for EUR/USD, USD/JPY, GBP/JPY, USD/CAD, Bitcoin, and Ripple – March 23
In the coming week, a continuation of the overall sideways (flat) movement of the euro between the nearest opposing zones is expected. An upward vector is more likely...
Relevance until2026-03-27Analytical expert:
2026-03-23

Forex Analysis
Weekly Forecast Based on Simplified Wave Analysis for EUR/USD, USD/JPY, GBP/JPY, USD/CAD, Bitcoin, and Ripple — March 16th
Over the coming week, the euro price is expected to move within a sideways channel between the nearest opposing zones. In the first days, an upward vector is more likely...
Relevance until2026-03-20Analytical expert:
2026-03-16

Crypto Analysis
Ripple expands into Saudi banking sector
XRP posted a solid gain yesterday despite broad weakness across the cryptocurrency market. Ripple announced a strategic partnership with Riyad Bank aimed at integrating blockchain technology to facilitate faster, lower?cost...
Relevance until2026-01-28Analytical expert:
2026-01-27

Crypto Analysis
Ripple rejects IPO plans
While Bitcoin shows renewed weakness amid another wave of outflows from spot ETFs, Ripple President Monica Long said the company will remain private and sees no need to go public...
Relevance until2026-01-09Analytical expert:
2026-01-08
Crypto Analysis
Crypto market: end of trading week and month
The cryptocurrency market is currently in a phase of recovery, but it maintains a high degree of volatility and susceptibility to external factors. Prospects will depend on the decisions made...
Relevance until2025-12-03Analytical expert:
2025-11-28
Crypto Analysis
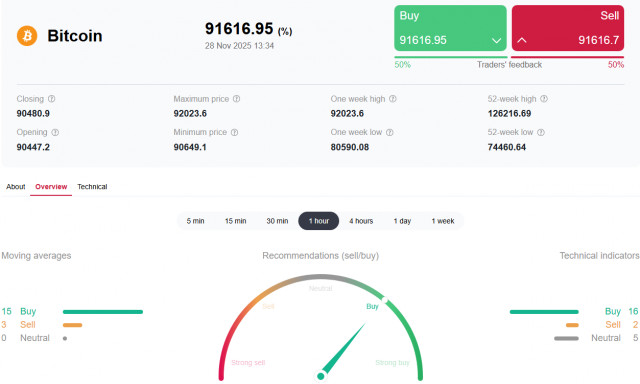
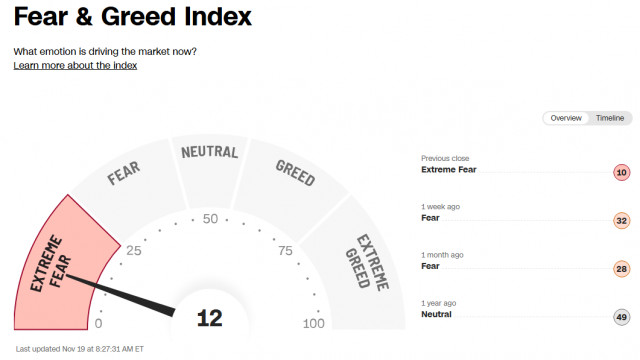
Crypto market: current situation
The modern cryptocurrency market continues to be extremely volatile and susceptible to global economic factors. The main concern for investors lies in the uncertainty surrounding the future direction of monetary...
Relevance until2025-11-22Analytical expert:
2025-11-19
Crypto Analysis
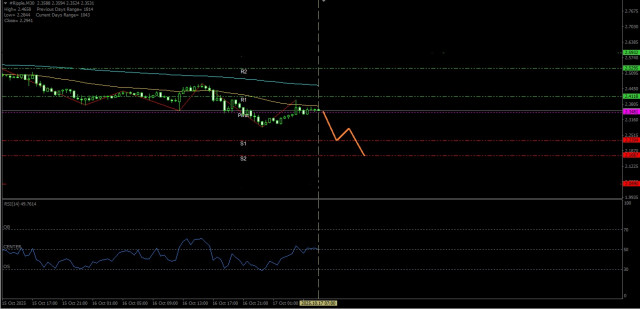
Ripple continues its decline today toward the nearest support. Friday, October 17, 2025.
[Ripple] – [Monday, October 1, 2025] Seeing the two EMAs intersecting the Death Cross has given an indication that Ripple has the potential to weaken today. Key Levels: 1. Resistance...
Relevance until2025-10-18Analytical expert:
2025-10-17