 English
  Русский
 Bahasa Indonesia
 Bahasa Malay
 ไทย
ไทย Español
 Deutsch
 Български
 Français
 Tiếng Việt
 中文
中文 বাংলা
বাংলা हिन्दी
 Čeština
 Українська
 Română
FX.co ★ Patterns SILVER | Silver Rate in the Forex market

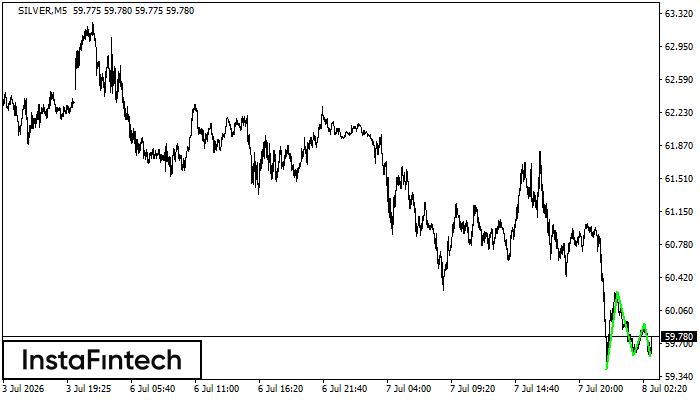
SILVER M5
Triple Bottom
The Triple Bottom pattern has been formed on SILVER M5. It has the following characteristics: resistance level 60.27/59.91; support level 59.41/59.56; the width is 860 points. In the event of a breakdown of the resistance level of 60.27, the price is likely to continue an upward movement at least to 59.58.
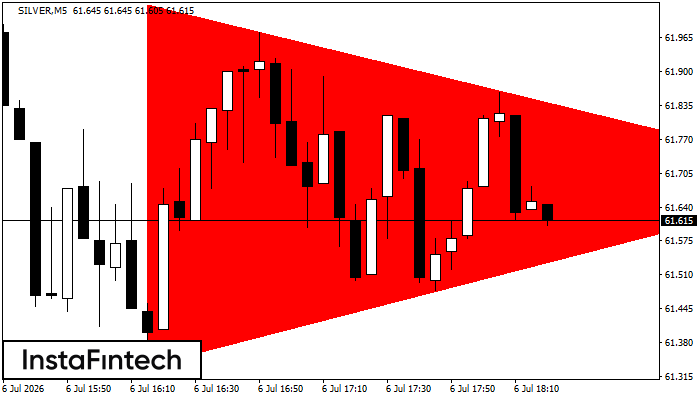
SILVER M5
Bearish Symmetrical Triangle
According to the chart of M5, SILVER formed the Bearish Symmetrical Triangle pattern. Description: The lower border is 61.34/61.69 and upper border is 62.03/61.69. The pattern width is measured on the chart at -694 pips. The formation of the Bearish Symmetrical Triangle pattern evidently signals a continuation of the downward trend. In other words, if the scenario comes true and SILVER breaches the lower border, the price could continue its move toward 61.68.
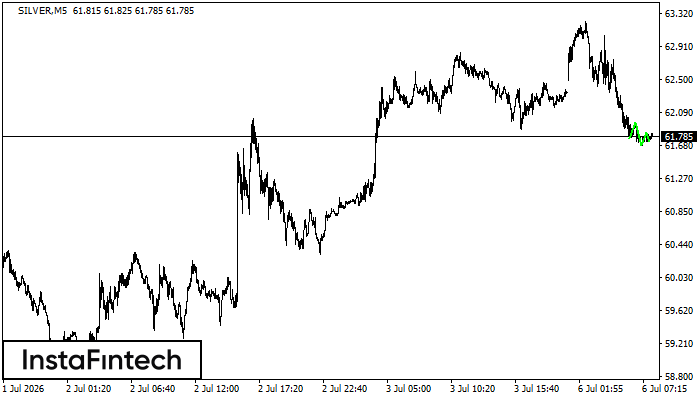
SILVER M5
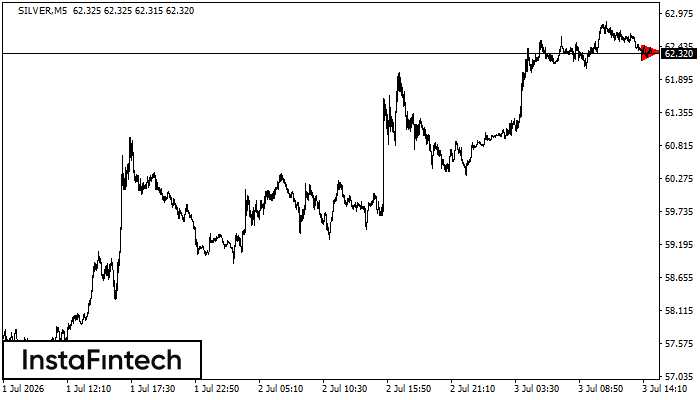
Triple Bottom
The Triple Bottom pattern has formed on the chart of SILVER M5. Features of the pattern: The lower line of the pattern has coordinates 61.96 with the upper limit 61.96/61.84, the projection of the width is 200 points. The formation of the Triple Bottom pattern most likely indicates a change in the trend from downward to upward. This means that in the event of a breakdown of the resistance level 61.76, the price is most likely to continue the upward movement.
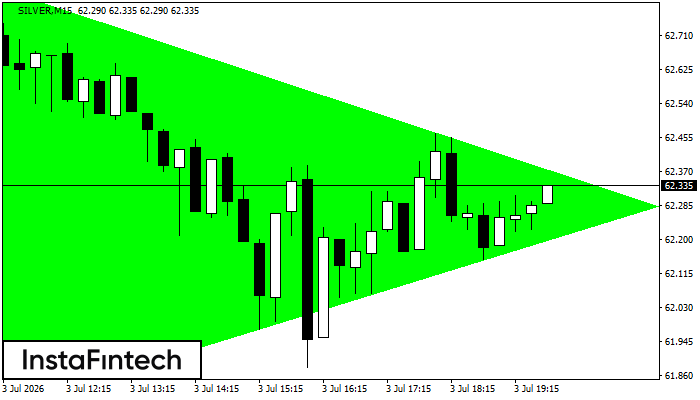
SILVER M15
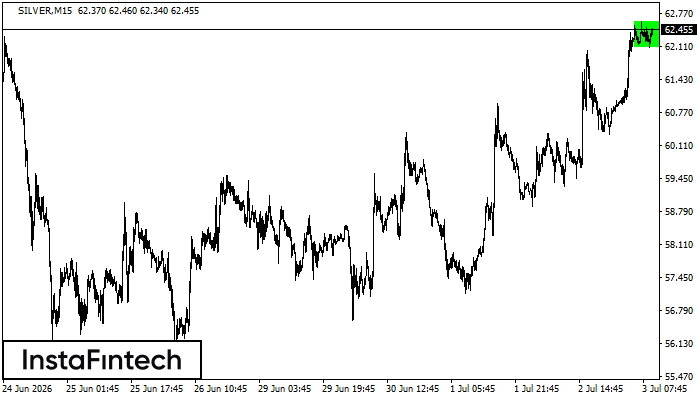
Bullish Symmetrical Triangle
According to the chart of M15, SILVER formed the Bullish Symmetrical Triangle pattern. The lower border of the pattern touches the coordinates 61.76/62.28 whereas the upper border goes across 62.84/62.28. If the Bullish Symmetrical Triangle pattern is in progress, this evidently signals a further upward trend. In other words, in case the scenario comes true, the price of SILVER will breach the upper border to head for 62.31.
SILVER M15
Bullish Rectangle
According to the chart of M15, SILVER formed the Bullish Rectangle which is a pattern of a trend continuation. The pattern is contained within the following borders: the lower border 62.08 – 62.08 and upper border 62.60 – 62.60. In case the upper border is broken, the instrument is likely to follow the upward trend.
SILVER M5
Bearish Symmetrical Triangle
According to the chart of M5, SILVER formed the Bearish Symmetrical Triangle pattern. This pattern signals a further downward trend in case the lower border 62.21 is breached. Here, a hypothetical profit will equal the width of the available pattern that is -258 pips.
SILVER M15
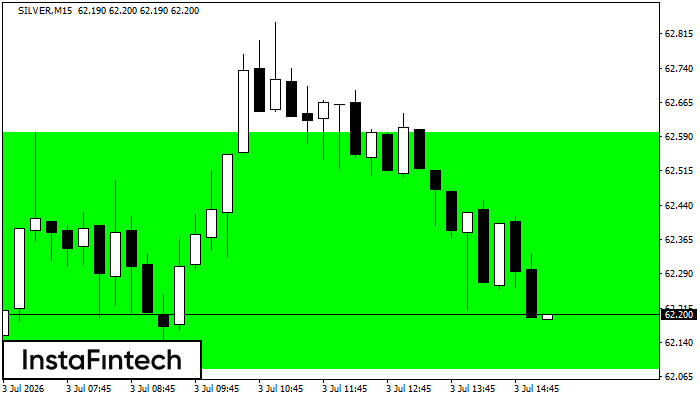
Bullish Rectangle
According to the chart of M15, SILVER formed the Bullish Rectangle which is a pattern of a trend continuation. The pattern is contained within the following borders: the lower border 62.08 – 62.08 and upper border 62.60 – 62.60. In case the upper border is broken, the instrument is likely to follow the upward trend.
SILVER M15
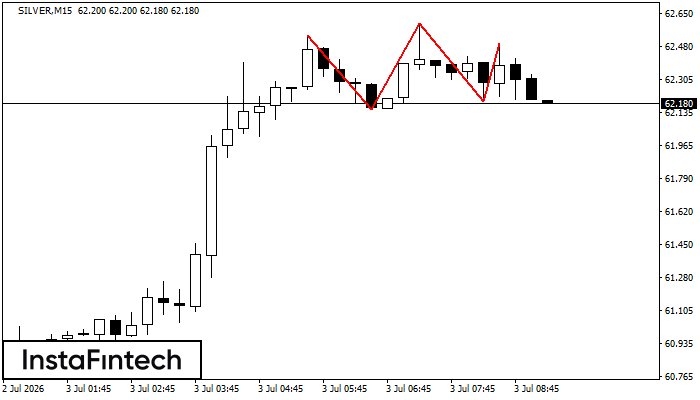
Triple Top
On the chart of the SILVER M15 trading instrument, the Triple Top pattern that signals a trend change has formed. It is possible that after formation of the third peak, the price will try to break through the resistance level 62.15, where we advise to open a trading position for sale. Take profit is the projection of the pattern’s width, which is 385 points.
SILVER M15
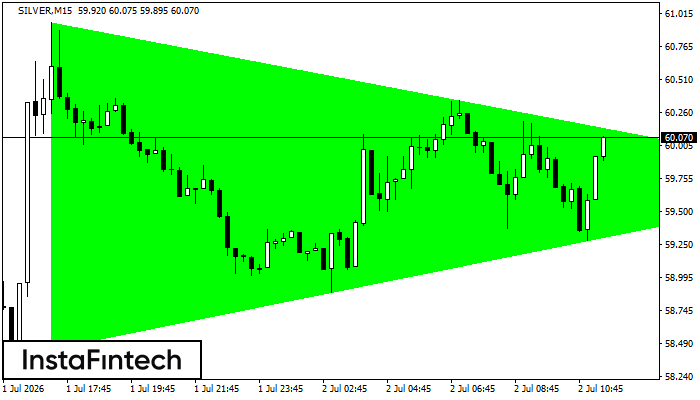
Bullish Symmetrical Triangle
According to the chart of M15, SILVER formed the Bullish Symmetrical Triangle pattern, which signals the trend will continue. Description. The upper border of the pattern touches the coordinates 60.95/59.73 whereas the lower border goes across 58.45/59.73. The pattern width is measured on the chart at 2497 pips. If the Bullish Symmetrical Triangle pattern is in progress during the upward trend, this indicates the current trend will go on. In case 59.73 is broken, the price could continue its move toward 59.76.
SILVER M5
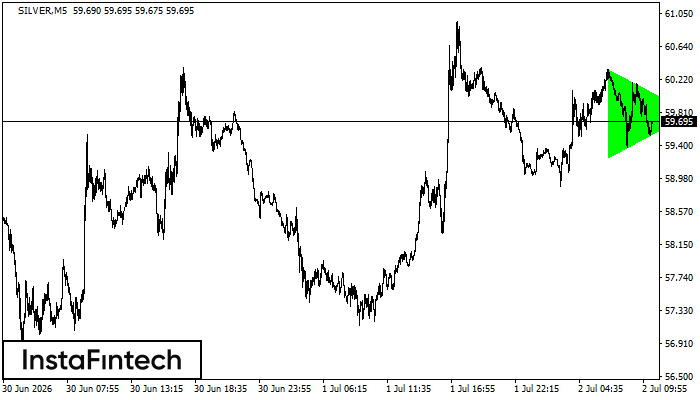
Bullish Symmetrical Triangle
According to the chart of M5, SILVER formed the Bullish Symmetrical Triangle pattern. Description: This is the pattern of a trend continuation. 60.35 and 59.25 are the coordinates of the upper and lower borders respectively. The pattern width is measured on the chart at 1099 pips. Outlook: If the upper border 60.35 is broken, the price is likely to continue its move by 59.81.