 English
  Русский
 Bahasa Indonesia
 Bahasa Malay
 ไทย
ไทย Español
 Deutsch
 Български
 Français
 Tiếng Việt
 中文
中文 বাংলা
বাংলা हिन्दी
 Čeština
 Українська
 Română
FX.co ★ Analytics usdidr

Forex Analysis
Technical Analysis of Daily Price Movement of USD/IDR Exotic Currency Pairs, Monday June 23, 2025.
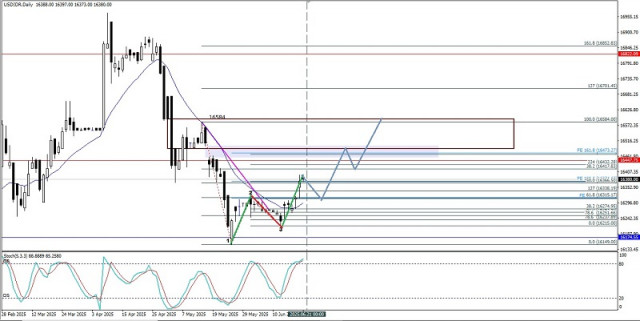
16473.27 Currently on the Daily chart, the Exotic USD/IDR currency pair has a Bullish 123 pattern which indicates that USD/IDR is currently strengthening, where this is also confirmed...
 Relevance until2025-06-28
Analytical expert:
2025-06-23
Forex Analysis
Technical Analysis of Daily Price Movement of USD/IDR Exotic Currency Pairs, Monday June 16, 2025.
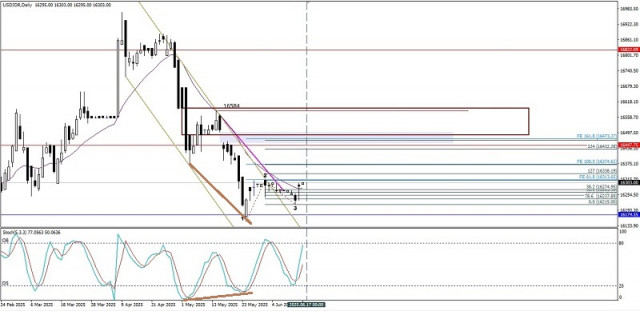
With the appearance of the Bullish 123 pattern in the midst of the weakening conditions of this exotic currency pair, that has been confirmed by the movement of the USD/IDR...
Relevance until2025-06-30Analytical expert:
2025-06-16
Forex Analysis
Technical Analysis of Daily Price Movement of USD/IDR Exotic Currency Pairs, Wednesday June 11, 2025.
There are some interesting facts about USD/IDR at the moment, first the price movement of USD/IDR is moving below WMA (21), second the appearance of Bearish 123 pattern followed...
Relevance until2025-06-13Analytical expert:
2025-06-11
Forex Analysis
Technical Analysis of Intraday Daily Price Movement of USD/IDR Exotic Currency Pairs, Monday May 26, 2025.
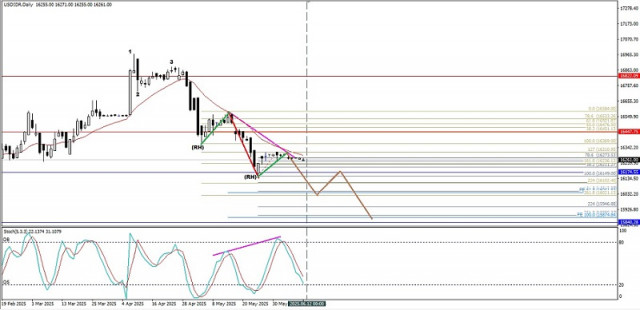
From what is seen on the daily chart of the exotic currency pair USD/IDR, it appears that a Bearish 123 pattern has showed up followed by a Bearish Ross Hook...
Relevance until2025-05-28Analytical expert:
2025-05-26

Forex Analysis
Technical Analysis of Daily Price Movement of USD/IDR Exotic Currency Pairs, Thursday May 15, 2025
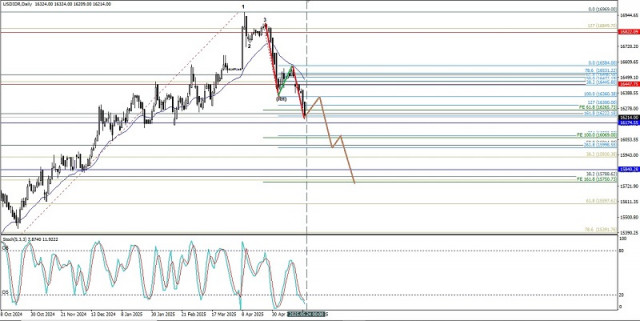
From what is seen on the daily chart, the Exotic USD/IDR currency pair appears to have a Bearish 123 pattern followed by the appearance of 2 Bearish Ross Hook (RH)...
Relevance until2025-05-29Analytical expert:
2025-05-15
Forex Analysis
Technical Analysis of Daily Price Movement of USD/IDR Exotic Currency Pairs, Thursday April 10, 2025.
On the daily chart, the exotic currency pair USD/IDR appears to have a fairly strong Bullish bias, which is indicated by its price movement moving above its EMA (21)...
Relevance until2025-04-24Analytical expert:
2025-04-10
Forex Analysis
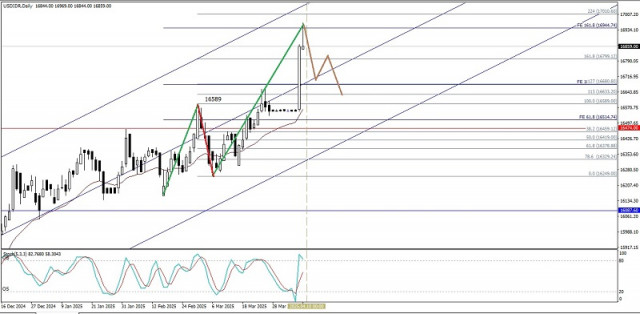
Technical Analysis of Daily Price Movement of USD/IDR Exotic Currency Pairs, Monday March 24, 2025.
On the daily chart, the exotic currency pair USD/IDR appears to be moving in a Bullish Pitchfork channel, which is confirmed by the price movement of this exotic currency pair...
Relevance until2025-04-07Analytical expert:
2025-03-24
Forex Analysis
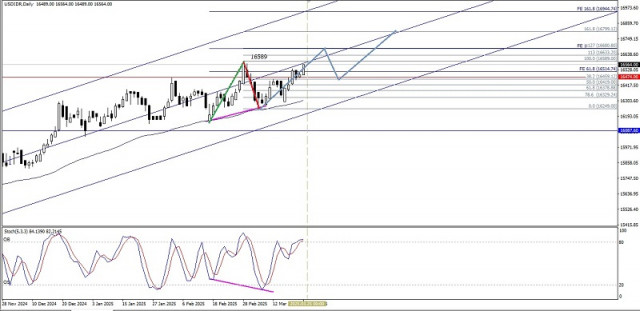
Technical Analysis of Daily Price Movement of USD/IDR Exotic Currency Pairs, Monday March 17, 2025.
On the 4-hour chart, the exotic currency pair USD/IDR appears to have a Head & Shoulders pattern, especially supported by the Divergence between the USD/IDR price movement and the Awesome...
Relevance until2025-03-31Analytical expert:
2025-03-17
Forex Analysis
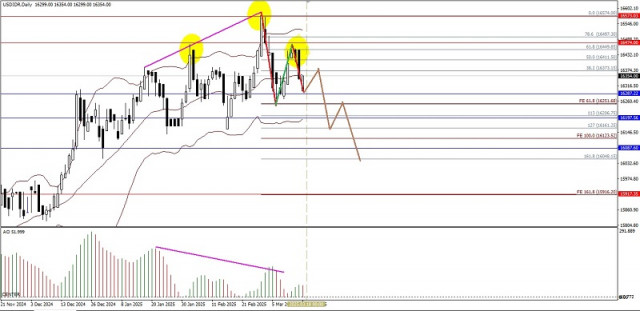
Technical Analysis of Daily Price Movement of USD/IDR Exotic Currency Pairs, Monday March 10, 2025.
On the daily chart, the exotic currency pair USD/IDR, although still in a Bull condition, but with the appearance of Divergence between price movements and the Awesome Oscillator indicator...
Relevance until2025-03-24Analytical expert:
2025-03-10
Forex Analysis
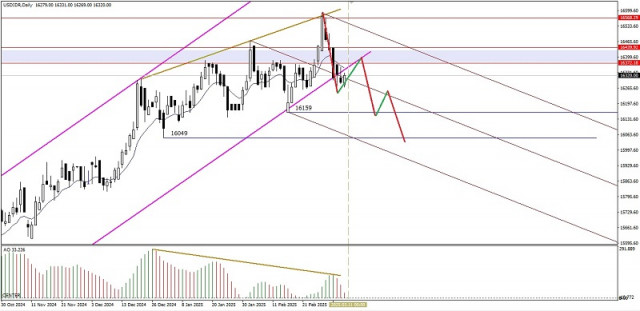
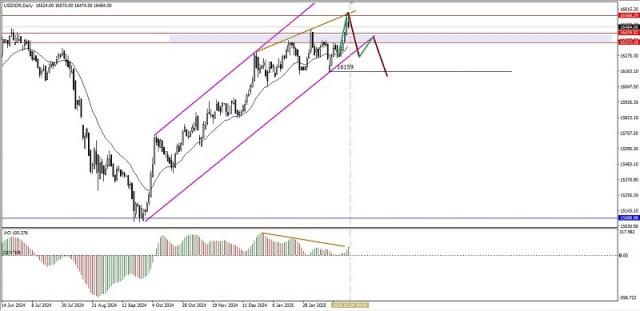
Technical Analysis of Daily Price Movement of USD/IDR Exotic Currency Pairs, Monday March 03, 2025.
In the next few days, the exotic currency pair USD/IDR has the opportunity to correct and weaken down to below the area level of 16439.92-16372.18 based on the appearance...
Relevance until2025-03-08Analytical expert:
2025-03-03