 English
  Русский
 Bahasa Indonesia
 Bahasa Malay
 ไทย
ไทย Español
 Deutsch
 Български
 Français
 Tiếng Việt
 中文
中文 বাংলা
বাংলা हिन्दी
 Čeština
 Українська
 Română
FX.co ★ Patterns USDJPY | US Dollar (USD) to Japanese Yen (JPY) Rate in the Forex market

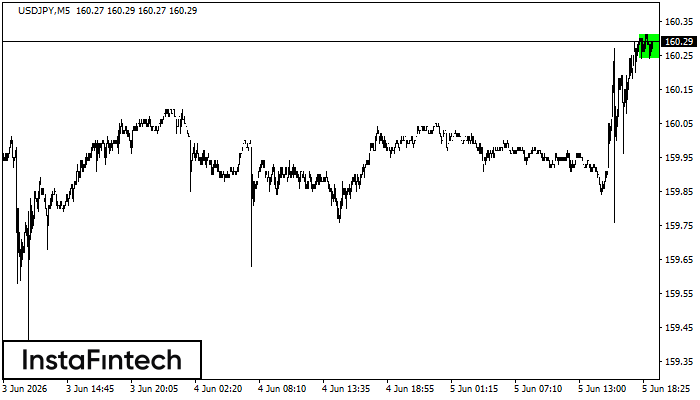
USDJPY M5
Bullish Rectangle
According to the chart of M5, USDJPY formed the Bullish Rectangle. This type of a pattern indicates a trend continuation. It consists of two levels: resistance 160.31 and support 160.24. In case the resistance level 160.31 - 160.31 is broken, the instrument is likely to follow the bullish trend.
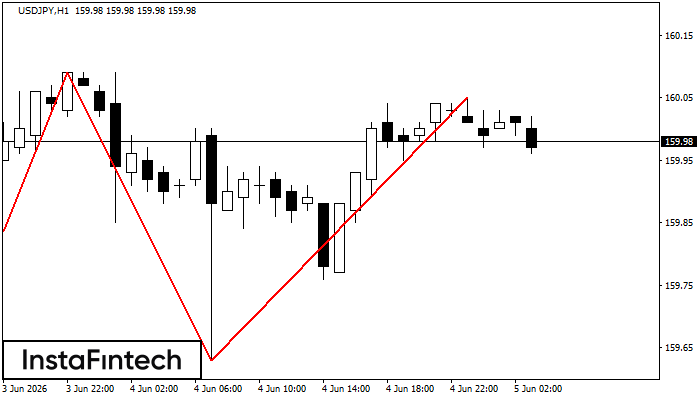
USDJPY H1
Triple Top
On the chart of the USDJPY H1 trading instrument, the Triple Top pattern that signals a trend change has formed. It is possible that after formation of the third peak, the price will try to break through the resistance level 159.39, where we advise to open a trading position for sale. Take profit is the projection of the pattern’s width, which is 62 points.
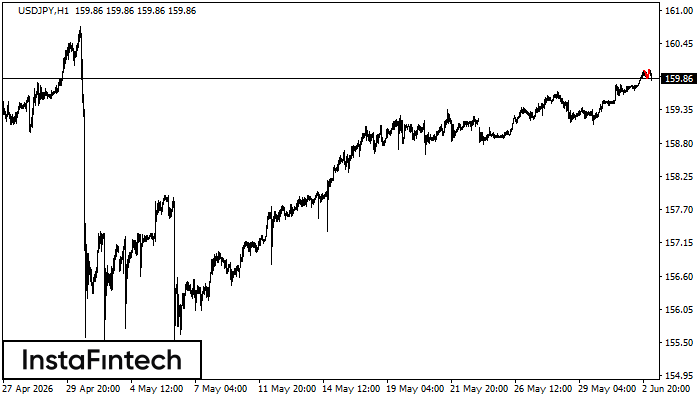
USDJPY H1
Double Top
The Double Top reversal pattern has been formed on USDJPY H1. Characteristics: the upper boundary 160.00; the lower boundary 159.87; the width of the pattern is 14 points. Sell trades are better to be opened below the lower boundary 159.87 with a possible movements towards the 159.47 level.
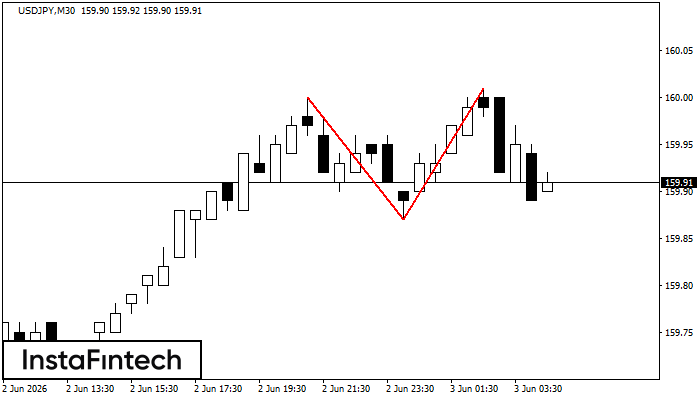
USDJPY M30
Double Top
The Double Top reversal pattern has been formed on USDJPY M30. Characteristics: the upper boundary 160.00; the lower boundary 159.87; the width of the pattern is 14 points. Sell trades are better to be opened below the lower boundary 159.87 with a possible movements towards the 159.57 level.
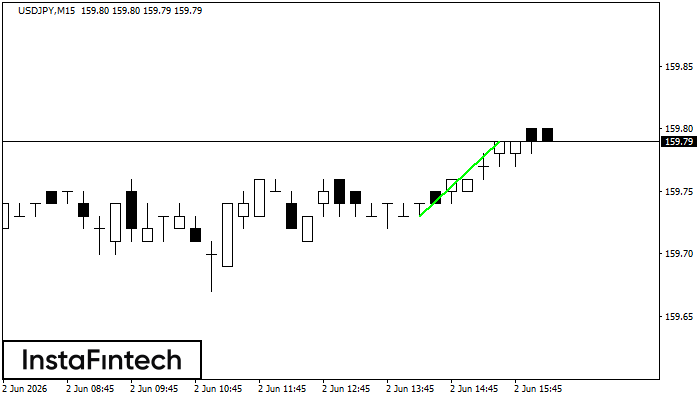
USDJPY M15
Bullish Flag
The Bullish Flag pattern has been formed on the chart USDJPY M15 which signals that the upward trend will continue. Signals: а break of the peak at 159.79 may push the price higher, and the rise will be the projection of the pole.
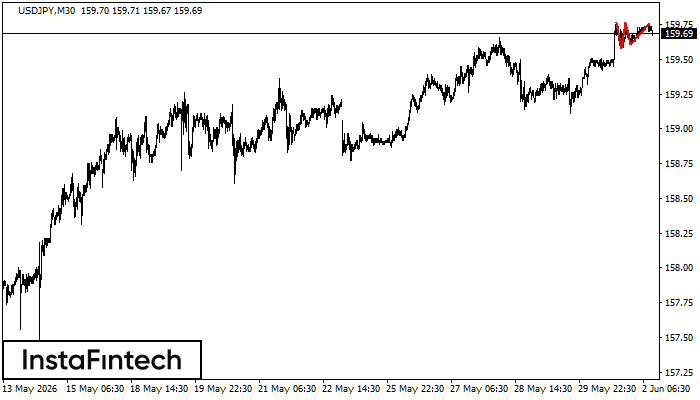
USDJPY M30
Triple Top
The Triple Top pattern has formed on the chart of the USDJPY M30 trading instrument. It is a reversal pattern featuring the following characteristics: resistance level 1, support level -3, and pattern’s width 19. Forecast If the price breaks through the support level 159.58, it is likely to move further down to 159.47.
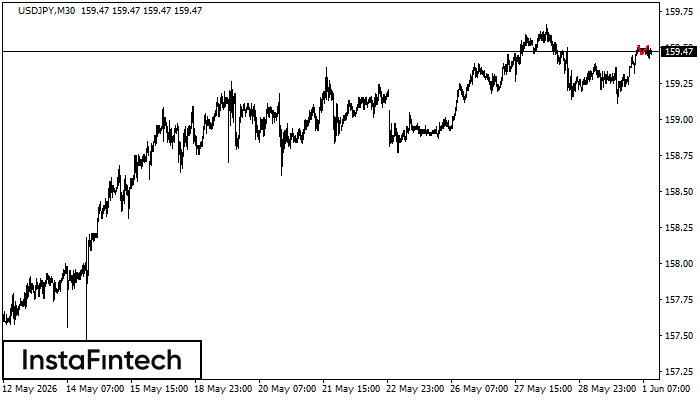
USDJPY M30
Double Top
The Double Top pattern has been formed on USDJPY M30. It signals that the trend has been changed from upwards to downwards. Probably, if the base of the pattern 159.45 is broken, the downward movement will continue.
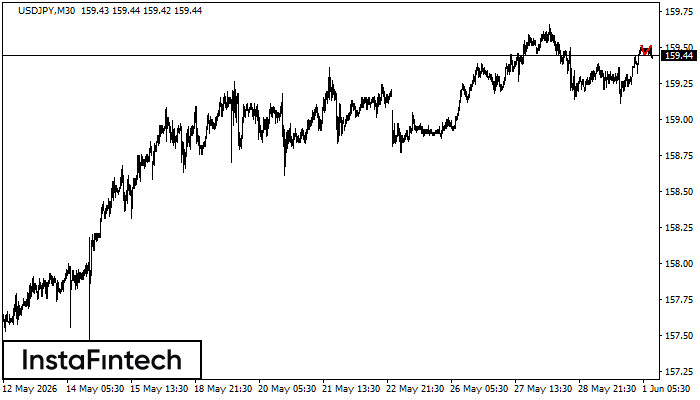
USDJPY M30
Double Top
The Double Top reversal pattern has been formed on USDJPY M30. Characteristics: the upper boundary 159.51; the lower boundary 159.45; the width of the pattern is 6 points. Sell trades are better to be opened below the lower boundary 159.45 with a possible movements towards the 159.15 level.
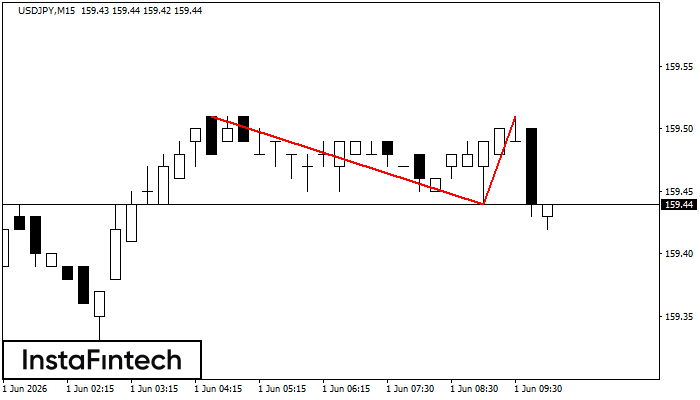
USDJPY M15
Double Top
The Double Top reversal pattern has been formed on USDJPY M15. Characteristics: the upper boundary 159.51; the lower boundary 159.44; the width of the pattern is 7 points. Sell trades are better to be opened below the lower boundary 159.44 with a possible movements towards the 159.21 level.
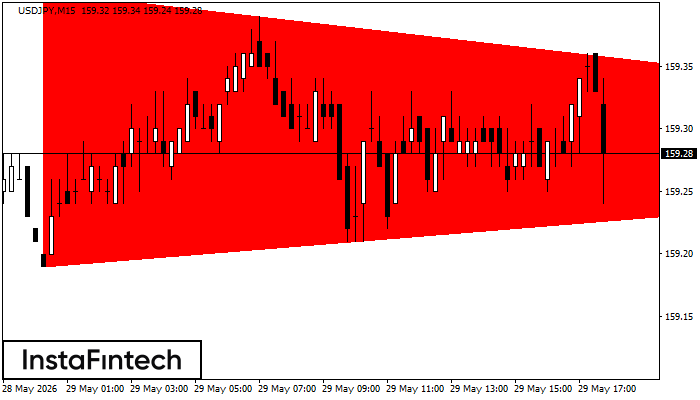
USDJPY M15
Bearish Symmetrical Triangle
According to the chart of M15, USDJPY formed the Bearish Symmetrical Triangle pattern. Description: The lower border is 159.19/159.28 and upper border is 159.41/159.28. The pattern width is measured on the chart at -22 pips. The formation of the Bearish Symmetrical Triangle pattern evidently signals a continuation of the downward trend. In other words, if the scenario comes true and USDJPY breaches the lower border, the price could continue its move toward 159.05.