 Geopolitical Sanctions Risk and Range-Bound Stagnation: GBP/USD Coils Ahead of Macro Catalysts
 The
GBP/USD (Cable) spot rate traded in a tight, low-volatility range on Wednesday, holding near
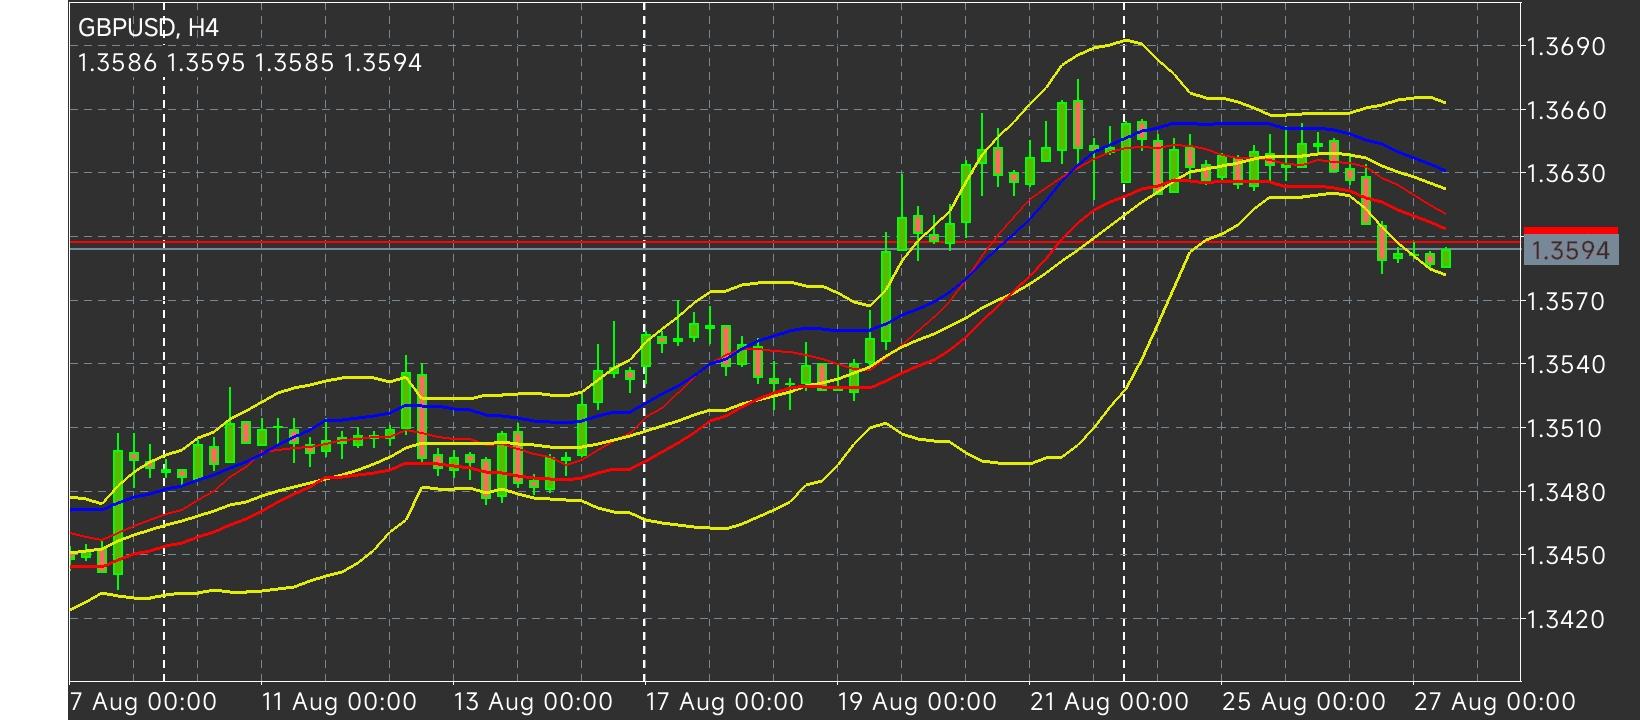
1.3585 as market participants absorbed U.S. GDP second-estimate figures and durable goods orders. Despite minor intraday fluctuations, overall price action remains constrained as traders await major catalysts, including upcoming U.S. Non-Farm Payrolls, Federal Reserve Chair Kevin Warsh's scheduled address at the Jackson Hole Symposium, and unfolding foreign policy developments. Markets are closely monitoring President Donald Trump's proposed economic blockade against Iran, which seeks to restrict global energy exports by imposing secondary sanctions on third-party trading partners such as China and Turkey. Strategic analysts warn that such measures risk retaliatory trade restrictions that could weigh on U.S. economic growth ahead of the upcoming Congressional midterms. Meanwhile, potential Iranian military countermeasures in the Strait of Hormuz keep geopolitical risk premiums elevated, offering underlying safe-haven insulation to the British Pound against broader U.S. Dollar weakness.
Multi-Timeframe Trend & Channel Dynamics: On the weekly timeframe, Cable continues to navigate a multi-year secular uptrend while oscillating within a macro consolidation range bounded between
1.3150 and
1.3780. On the 4-hour and daily charts, the linear regression channels remain sloped to the upside, signaling that the broader path of least resistance favors buyers.
Volatility Compression & Overbought Indicators: GBP/USD's average 5-day true range has contracted to 52 pips, reflecting low-volatility structural compression. Additionally, the Commodity Channel Index (CCI) indicator has repeatedly pushed into overbought territory (above +250), issuing technical warnings of an imminent interim pullback or extended sideways correction before trend continuation.
Moving Average Positioning: Price action continues to hover near the 20-period smoothed moving average. A sustained hold above this dynamic axis preserves short-term bullish momentum, whereas a breakdown below the line would trigger an intraday corrective sequence toward lower channel boundaries. From an operational chart analysis perspective, key technical levels and target zones are structured as follows:
Overhead Resistance Targets: Immediate horizontal resistance rests at
R1 (1.3611), followed by the projected volatility ceiling at
1.3639. A confirmed breakout above this zone opens direct technical paths toward
R2 (1.3672) and primary expansion targets at
R3 (1.3733).
Key Support Boundaries: Immediate downside protection aligns with
S1 (1.3550) and the daily volatility floor at
1.3535. Should selling pressure intensify, deeper structural support floors are stacked at
S2 (1.3489) and
S3 (1.3428). The technical trend structure for GBP/USD remains constructively bullish across higher timeframes while spot prices hold above the
1.3535–1.3550 demand zone. Although overbought CCI readings and range-bound volatility suggest near-term consolidation, holding above dynamic moving average support points toward an eventual retest of
1.3672 and
1.3733, whereas a closing breakdown below
1.3535 would shift short-term bias toward corrective downside targets.
*การวิเคราะห์ตลาดตามนี้จัดทำขึ้นเพื่อสร้างความเข้าใจให้กับคุณ แต่ไม่ได้เป็นการชี้แนะแนวทางในการซื้อขาย T
 ไทย
ไทย 
 Русский
 English
 Bahasa Indonesia
 Bahasa Malay
 Español
 Deutsch
 Български
 Français
 Tiếng Việt
 中文
中文 বাংলা
বাংলা हिन्दी
 Čeština
 Українська
 Română
