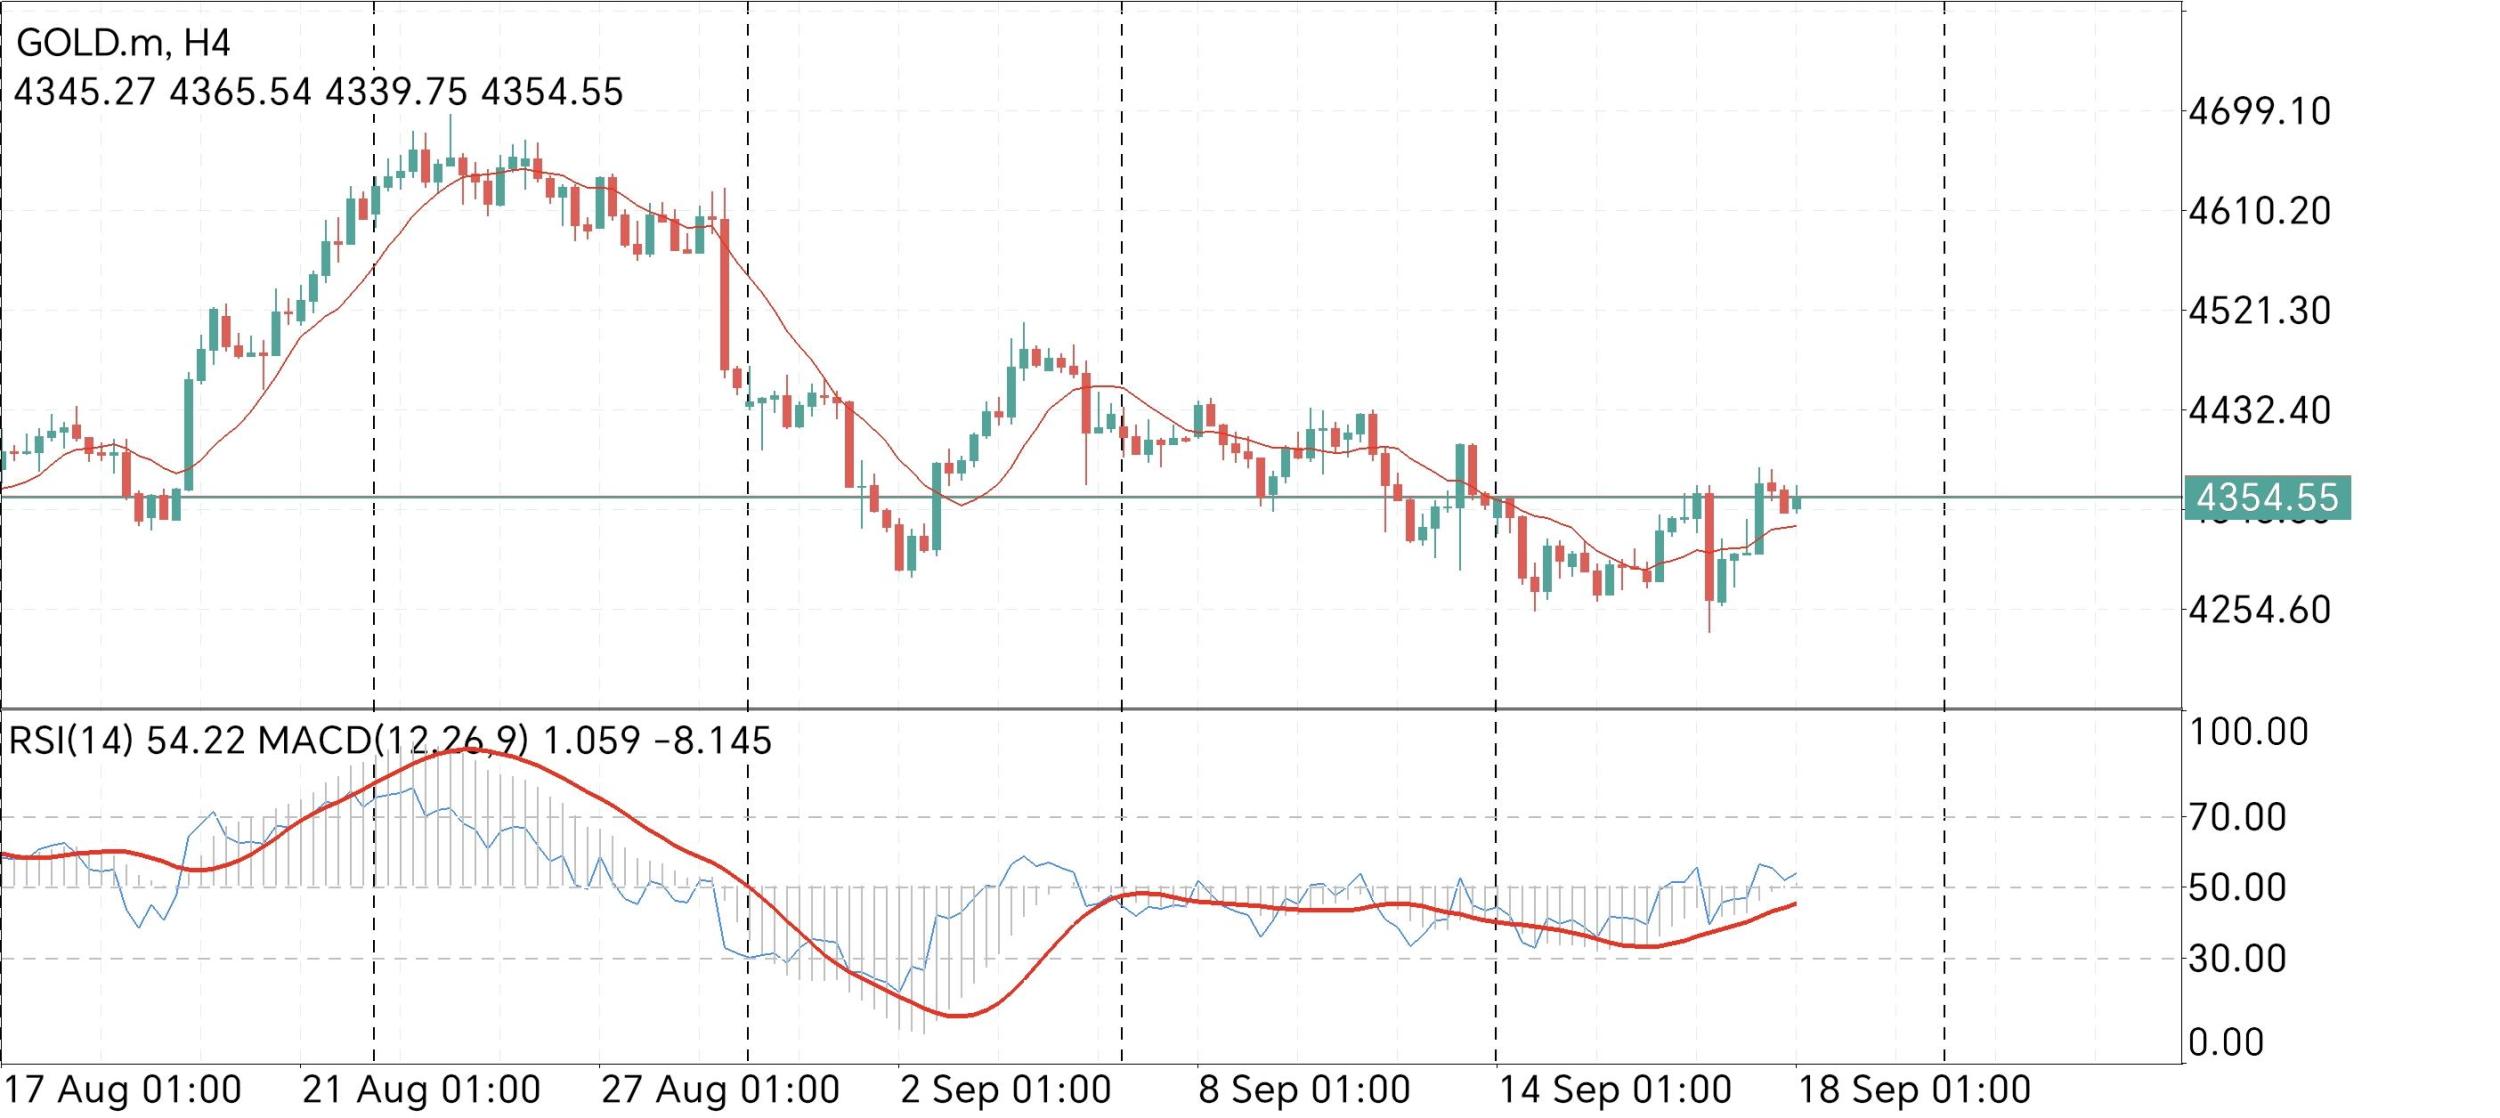
 Analysis of the XAUUSD (Gold) H4 Chart
 The chart provided displays the price action of Gold versus the US Dollar (XAUUSD) on a 4-hour (H4) timeframe, spanning from mid-August to mid-September. Based on classical price action principles, the primary trend is currently bearish to neutral. Following a significant peak around August 21st near the 4699 level, the market initiated a series of lower highs and lower lows, confirming a downtrend. The price action formed a distinct impulse leg downward, dropping to a swing low near 4254. Since early September, however, the bearish momentum has decelerated, transitioning into a consolidation phase characterized by choppy, range-bound movement. The price is currently testing the 4354 level, which aligns with the 20-period moving average (red line), suggesting a potential shift in short-term market structure as the market attempts to base near the 4250-4300 zone. In terms of market geometry, the nearest major support level is firmly established at the recent swing low of 4254.60, a level that has held twice, suggesting a demand zone. Minor support sits around the 4320-4330 area. On the upside, the nearest resistance is located at 4432.40, a previous support level that has now flipped into a ceiling. Above this, the 4521.30 level serves as the major resistance that would need to be reclaimed to invalidate the current bearish structure. The chart does not show a perfect double top, but the structure resembles a complex correction or a potential "Rounding Bottom" attempt. The RSI indicator (54.22) is slightly bullish, signaling a recovery in momentum, while the MACD (1.059) shows a bullish crossover with the histogram turning positive, indicating that the selling pressure has exhausted and buyers are stepping in. The current market structure is defined by a sharp depreciation followed by a stabilization period. The price is compressing within a specific range, creating a potential accumulation phase. Given this setup, two scenarios are highly probable. The Bullish Scenario: If the price successfully breaks and closes above the immediate resistance at 4432.40 with increasing volume, it would confirm a double-bottom reversal, targeting a move back towards 4521.30. The Bearish Scenario: If the price rejects the current resistance at the moving average (around 4360) and falls below the recent consolidation lows near 4320, it would signal a continuation of the primary downtrend, likely retesting the 4254 support level. The current price action suggests the bulls are attempting a comeback, but they must overcome the 4430 barrier to confirm a trend reversal. Trade Setup & Summary The market is currently in a consolidation phase with a slight bullish bias on the oscillators. A conservative trader should wait for a breakout. Buy Entry: Above 4365 (current H4 candle close) targeting 4432 and 4500, with a Stop Loss at 4310. Sell Entry: A rejection wick at 4432 or a break below 4320 targeting 4255, with a Stop Loss at 4380. The overall bias remains cautious as Gold recovers from oversold conditions; patience is required until price validates direction by breaking the 4432 resistance or 4254 support.
*การวิเคราะห์ตลาดตามนี้จัดทำขึ้นเพื่อสร้างความเข้าใจให้กับคุณ แต่ไม่ได้เป็นการชี้แนะแนวทางในการซื้อขาย T
 ไทย
ไทย 
 Русский
 English
 Bahasa Indonesia
 Bahasa Malay
 Español
 Deutsch
 Български
 Français
 Tiếng Việt
 中文
中文 বাংলা
বাংলা हिन्दी
 Čeština
 Українська
 Română
