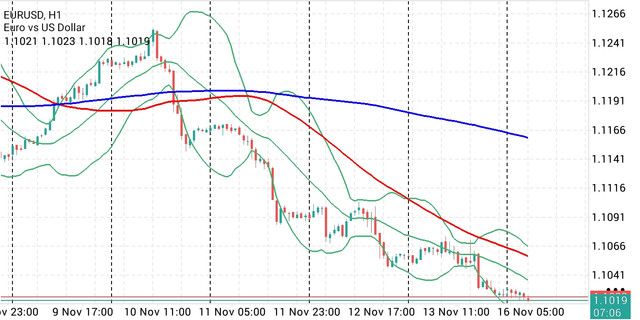
Using the EUR/USD currency chart on the H1 timeframe that you sent, the current market condition shows a fairly strong BEARISH tendency (downtrend). Price movement shows a gradual decline pattern, accompanied by the formation of lower high and lower low. This indicates that selling pressure still dominates the market. 1. Market Trend Analysis It can be seen that the EUR/USD price previously rose up to the 1.1240–1.1250 area. However, after reaching that area, the price reversed and formed a fairly significant downtrend. The red Moving Average line appears to be pointing downward. This shows that short-term momentum is still controlled by sellers. Meanwhile, the blue Moving Average is well above the current price and is also beginning to show a downward slope. These conditions reinforce the indication that the medium-term trend is still bearish. 2. Bollinger Bands Analysis The Bollinger Bands indicator shows that price movement tends to be around the middle band and approaching the lower band. This indicates bearish pressure remains quite dominant. In some parts of the chart, the price moves along the lower Bollinger Band. This can be an indication of a strong downtrend. However, traders should be cautious because a price that is too close to the lower band also has the potential to experience a temporary correction. 3. Trading Entry Strategy The primary strategy prioritized is SELL or following the main trend. Area SELL pertama: 1.1040–1.1060. Second SELL area: 1.1060–1.1090, if a higher correction occurs and a price rejection confirmation appears. First target profit: 1.1010. Second target profit: 1.0990. Third target profit: 1.0970, if bearish pressure continues. Avoid SELLING hastily when the price is already too close to the lower Bollinger Band. It's better to wait for the price to pull back first, then look for bearish candlestick confirmation. 4. BUY Strategy For the time being, BUY is not the primary option because market structure still shows a downtrend. BUY can only be considered if the price manages to break the 1.1066 resistance, holds above it, and forms a higher high and higher low structure on the H1 timeframe. 5. Risk Management Use a stop loss on every trade. Adjust the stop loss distance according to the resistance structure or the last swing high. Limit the risk from total capital for each trade. Avoid opening excessive positions and do not use martingale when experiencing losses. 6. Conclusion and Recommendations Overall, EURUSD still shows a bearish tendency. The price is around 1.1019 and still well below both Moving Averages. A more rational strategy is to wait for an upward correction to look for SELL opportunities with candlestick confirmation. However, do not force an entry if the price continues to fall without giving a pullback opportunity. Also pay attention to US and European economic news as volatility can change at any time.
*การวิเคราะห์ตลาดตามนี้จัดทำขึ้นเพื่อสร้างความเข้าใจให้กับคุณ แต่ไม่ได้เป็นการชี้แนะแนวทางในการซื้อขาย T
 ไทย

 Русский
 English
 Bahasa Indonesia
 Bahasa Malay
 Español
 Deutsch
 Български
 Français
 Tiếng Việt
 中文
 বাংলা
 हिन्दी
 Čeština
 Українська
 Română

