 English
  Русский
 Bahasa Indonesia
 Bahasa Malay
 ไทย
ไทย Español
 Deutsch
 Български
 Français
 Tiếng Việt
 中文
中文 বাংলা
বাংলা हिन्दी
 Čeština
 Українська
 Română
FX.co ★ Analytics #T | AT&T Inc. Stock Price


Analysis News
US Market News Digest for August 27
The S&P 500 is approaching a new record amid a stable economy and expectations of Fed rate cuts. Investors are disregarding political tensions, including President Trump's efforts to replace FOMC...
 Relevance until2025-08-28
Analytical expert:
2025-08-27

Forex Analysis
US premarket on May 11: stock market may hit bottom amid inflation fears
Many traders are waiting for the release of the Consumer Price Index for April, which will give a more clear view of what is now happening with inflation. Rising prices...
Relevance until2022-05-12Analytical expert:
2022-05-11

Forex Analysis
US premarket on April 21: Powell's statements may hurt stock market and strengthen USD
US stock index futures rose on Thursday as investors reacted well to quarterly reports from Tesla and United Airlines. Today's highlight will be a speech by Federal Reserve Chairman Jerome...
Relevance until2022-04-22Analytical expert:
2022-04-21

Forex Analysis
US premarket on April 11, 2022
US stock index futures traded in negative territory before Monday's opening bell. Treasuries also fell as investors focused on inflation and the likely monetary tightening by many central banks. NASDAQ...
Relevance until2022-04-12Analytical expert:
2022-04-11
Forex Analysis
US premarket on October 19: US stock market one step away from yearly high and Tesla shares fall after Q3 report
Futures on US stock indexes declined in early trading on Thursday after the Dow Jones Industrial Average index rose to a record high in the trading session on Wednesday amid...
Relevance until2021-10-22Analytical expert:
2021-10-21

Forex Analysis
Buying and Selling in the Stock Market on June 1
Purchase of Nintendo shares (#NTDOY). A Japanese company that makes video games and consoles. On the weekly chart, the price went above the indicator lines of the balance and MACD...
Relevance until2021-06-02Analytical expert:
2021-06-01

Forex Analysis
Buying and Selling on the stock market 03/05/21
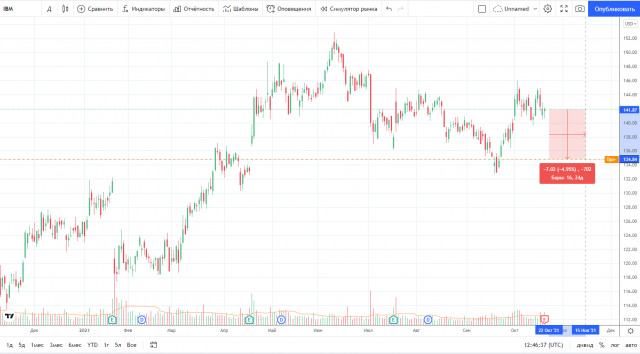
Purchase of ATT shares (#T). Based on the weekly stock price chart of the American telecommunications company ATT, the signal line of the Marlin oscillator went up from the border...
Relevance until2021-03-06Analytical expert:
2021-03-05
Forex Analysis
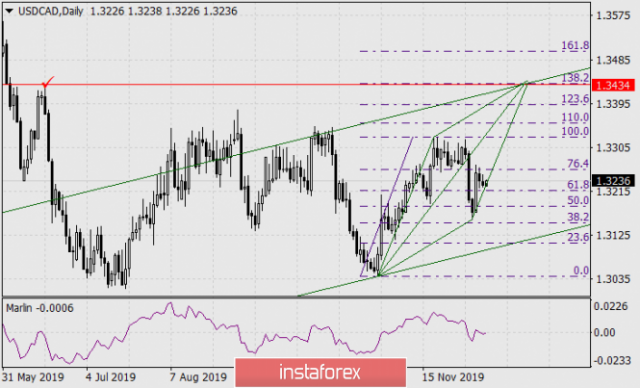
Promising deals until the end of the year
USD/CAD The signal line of the leading indicator Marlin went above the zero line (0.00) in the daily chart - into the zone of positive values. This is an occasion...
 Long-term review
Analytical expert:
2019-12-11