 Bitcoin Price Forecast: BTC Battles Key Resistance as ETF Outflows and Geopolitical Risks Limit Recovery Bitcoin Rebound Faces a Critical Test
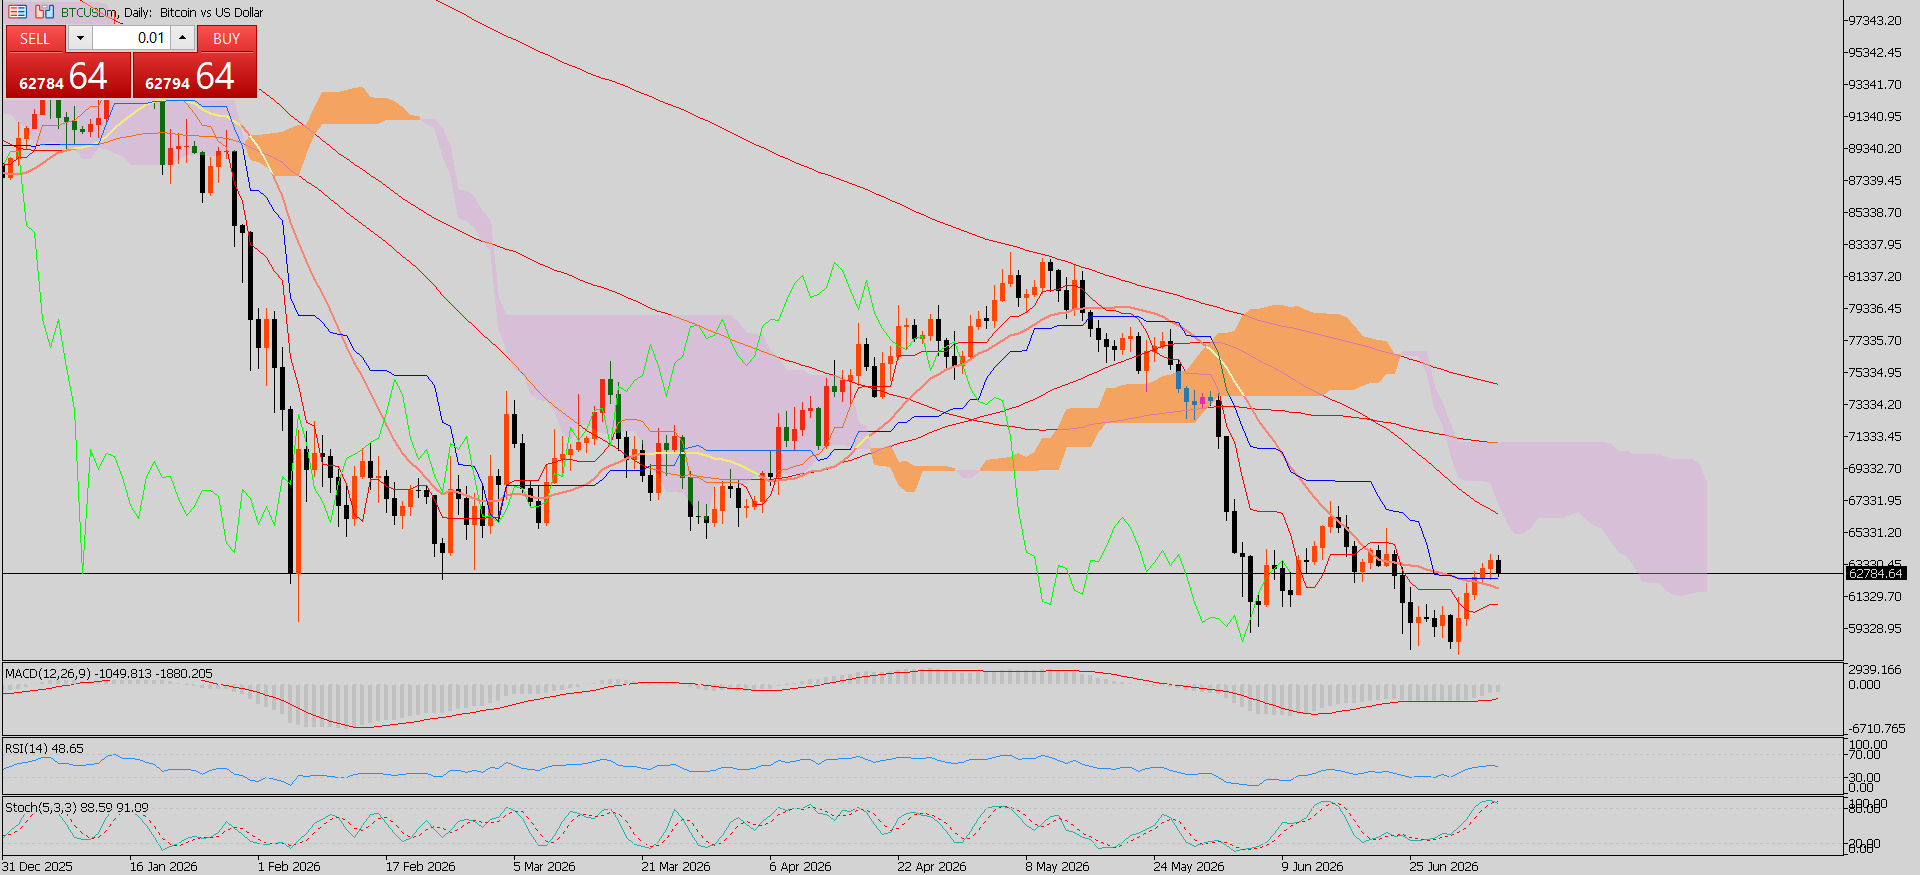
 Bitcoin is trading near $62,800-$63,000 at the start of the week after recovering more than 6% from recent lows, yet the broader technical picture still calls for caution. The daily chart shows buyers attempting to regain control after defending the long-term support zone around $58,000-$60,000, but the recovery has already started to encounter heavy selling pressure beneath the $64,000 resistance area. While the latest bounce has improved short-term sentiment, Bitcoin continues to trade below the 50-day, 100-day, and 200-day Exponential Moving Averages, indicating that the broader trend has not fully shifted back in favor of bulls. Until these dynamic barriers are reclaimed, every rally is likely to face renewed profit-taking. The recent recovery has certainly eased immediate downside pressure, though the market still needs stronger confirmation before declaring that a sustainable uptrend has begun.
Trend Structure Shows Early Recovery but Bears Still Hold the Upper Hand The chart reflects a market that remains inside a broader bearish structure despite improving short-term momentum. Following the sharp decline from the May highs, Bitcoin established a temporary base around the yearly lows before staging a healthy rebound. Recent candles have started producing slightly higher lows, suggesting that buyers are gradually returning. However, price action continues to struggle beneath a cluster of moving averages and the Ichimoku Cloud, both of which continue to point toward overhead supply. The descending trendline from previous swing highs also remains intact, reinforcing the view that the recovery is still corrective rather than a confirmed trend reversal. Unless Bitcoin can break above these technical barriers with strong volume, the prevailing market structure still favors cautious optimism instead of outright bullish conviction.
Support and Resistance Levels Define the Next Major Move The immediate technical battlefield sits around $64,000, where horizontal resistance aligns closely with recent price rejection. A sustained breakout above this level would significantly strengthen bullish sentiment and expose the 50-day EMA near $65,744 as the next upside objective. Beyond that, additional resistance emerges near the 100-day EMA around $69,455, followed by the much stronger 200-day EMA near $75,471, where longer-term sellers are expected to become active once again. If bullish momentum remains strong enough to overcome those barriers, the longer-term resistance zone around $84,410 would become the next major target. On the downside, the 200-week Simple Moving Average near $62,867 remains the first key support. A daily close below that level would increase the probability of another decline toward $60,000, while the broader ascending trendline around $58,000 remains the most important support protecting the longer-term market structure. Losing that area would expose the yearly low near $57,800, where buyers would likely attempt another defense.
Indicators Point to Improving Momentum Without Confirming a Full Reversal Technical indicators present a mixed but gradually improving picture. The MACD on the daily timeframe has crossed into positive territory and continues to build a stronger histogram, indicating that bullish momentum is recovering after weeks of persistent selling. Meanwhile, the RSI has climbed toward the neutral 49 region, showing that bearish pressure has eased considerably but buyers still lack the strength normally associated with a sustained breakout. On the weekly timeframe, however, momentum remains more cautious, with the MACD still below its signal line and the RSI holding near 38, reflecting that the broader trend continues to lean bearish despite recent stabilization. The Ichimoku Cloud also continues to sit well above current price, suggesting that Bitcoin must overcome multiple technical barriers before the long-term trend can be considered constructive again.
Fundamentals Continue to Shape Market Sentiment Beyond the chart, fundamental developments remain equally important for Bitcoin's direction. Institutional participation has weakened noticeably, with spot Bitcoin ETFs recording more than $526 million in net outflows last week, extending the streak of withdrawals to eight consecutive weeks. Persistent institutional selling limits liquidity and reduces the probability of an aggressive upside breakout in the near term. At the same time, geopolitical uncertainty continues to influence investor sentiment. Although markets initially welcomed easing tensions between the United States and Iran, fresh concerns surrounding the Strait of Hormuz have revived risk aversion. Iran's proposal to introduce additional service fees for vessels passing through the strategic shipping route has kept investors cautious, preventing a stronger shift toward risk assets such as Bitcoin. These macro developments continue to add an additional layer of uncertainty alongside the technical picture.
Bullish and Bearish Scenarios with Final Outlook The bullish case becomes significantly stronger if Bitcoin successfully closes above $64,000, as that would confirm improving buying interest and potentially accelerate gains toward $65,744, $69,455, and eventually $75,471. Stronger momentum, improving MACD readings, and stabilization above the 200-week moving average would further reinforce confidence that a medium-term recovery is underway. However, the bearish scenario remains equally relevant. Failure to overcome the current resistance zone could invite another wave of selling pressure, particularly if ETF outflows continue or geopolitical tensions intensify further. A break below $62,867 would likely expose $60,000, followed by the major trendline support near $58,000, where the longer-term outlook would once again come under serious pressure. Overall, Bitcoin is showing encouraging signs of recovery after defending an important support region, but the market has not yet delivered the decisive technical confirmation needed to shift the broader trend back to bullish. The coming sessions around the $64,000 resistance area will likely determine whether this rebound develops into a sustainable recovery or proves to be another temporary bounce within the prevailing bearish structure.
* Phân tích thị trường được đăng ở đây nhằm mục đích nâng cao nhận thức của bạn, nhưng không đưa ra hướng dẫn để thực hiện giao dịch
 Tiếng Việt
 Русский
 English
 Bahasa Indonesia
 Bahasa Malay
 ไทย
ไทย Español
 Deutsch
 Български
 Français
 中文
中文 বাংলা
বাংলা हिन्दी
 Čeština
 Українська
 Română
