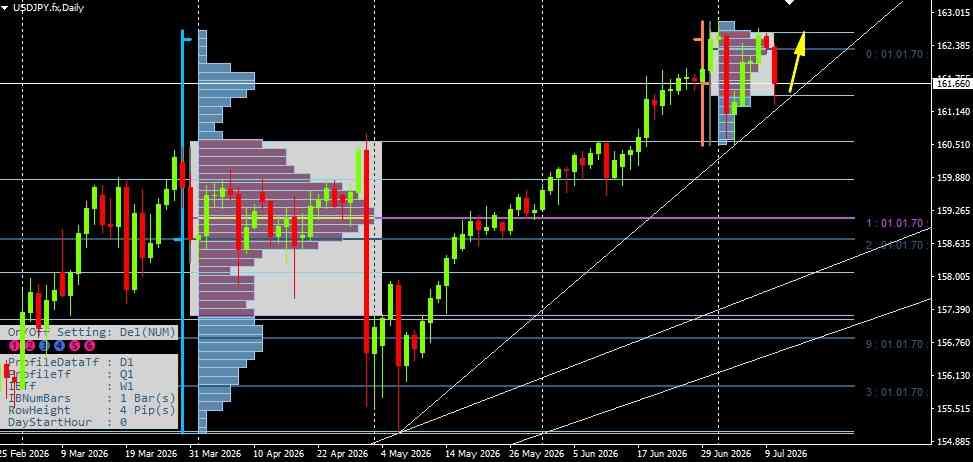
Greetings, colleagues. Currency pair USD/JPY. Daily timeframe. The instrument is showing powerful and stable growth. The global trend is strictly northbound. Buyers fully control the market. The price is moving along a strong upward trendline. The structure is long. Each new low is higher than the previous one. Recently the bulls updated the local highs. The price climbed into the 162.30 area. There the upward impulse slowed down. A small consolidation formed at the top. We see a local spike. Sellers are trying to organize a technical pullback. A small sell-off has begun. Right now the pair is trading around 161.66. The instrument is testing the ascending support line. This is an important zone for medium-term players. If the trendline is held, the growth will continue. If they push it lower, a deep correction down will begin. I’m looking at the volumes in the lower pane and on the chart. A dense volume shelf has formed below. I highlight key levels for myself. The nearest support is at 161.66 and 160.92. Below there is a strong level at 159.12. Resistance is at 162.03 and 162.32. My plan is simple. I’m waiting for the current southern pullback to finish. I will not sell against a strong trend. That’s a huge risk. I will look for a long entry point from supports. Ideally, I want to see a test of the 160.92 level. A false breakout of this mark will confirm the strength of the bulls. I expect buying to resume. My target above is a return to the high at 162.32. After that, the road opens to 163.14. I’ll hide my stop behind the nearest local low. If the trendline is broken, I’ll cancel the long scenario and reconsider my positions.
* Phân tích thị trường được đăng ở đây nhằm mục đích nâng cao nhận thức của bạn, nhưng không đưa ra hướng dẫn để thực hiện giao dịch
 Tiếng Việt
 Русский
 English
 Bahasa Indonesia
 Bahasa Malay
 ไทย
ไทย Español
 Deutsch
 Български
 Français
 中文
中文 বাংলা
বাংলা हिन्दी
 Čeština
 Українська
 Română
