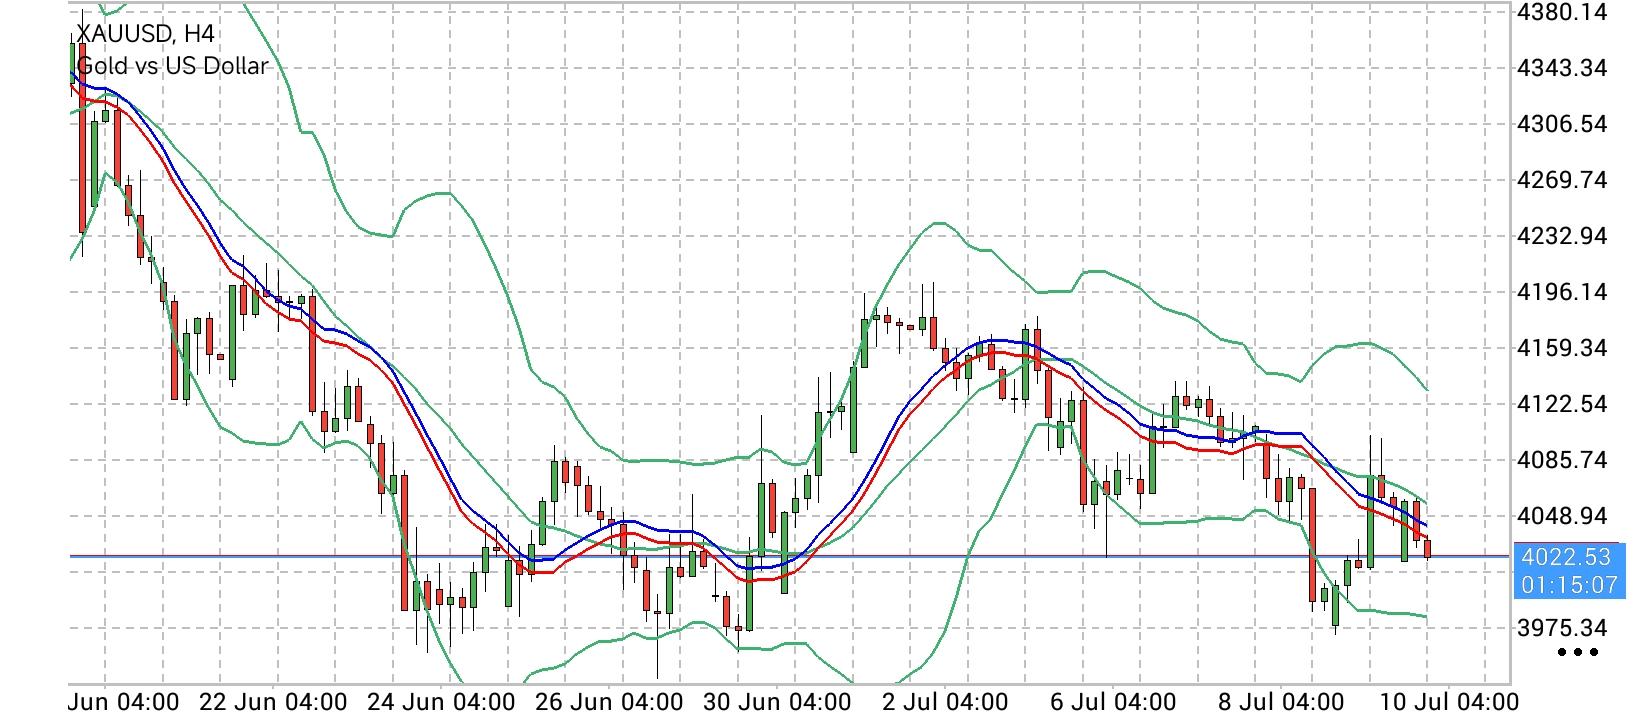
 THE STAGFLATION SQUEEZE: GOLD FACES RENEWED SELLING PRESSURE AS HORMUZ BLOCKADE REKINDLES RATES RISK
 The spot gold market (XAU/USD) encountered fresh bearish headwinds during early Wednesday trading, with prices turning back toward the
$4,030 region after failing to sustain territory above the pivotal
$4,100 milestone. While a surprisingly benign US Consumer Price Index (CPI) report on Tuesday initially triggered a sharp short-squeeze, the relief rally quickly evaporated. Investors remain intensely concerned about a structural resurgence of energy-driven inflation. Escalating military kinetic actions between the United States and Iran, alongside Tehran's unilateral closure of the Strait of Hormuz, have kept global crude oil prices pinned near one-month highs. Because energy costs serve as a primary precursor for broader pricing pressures, markets are rapidly concluding that the CPI’s drop to 3.5% year-on-year may prove to be a temporary statistical aberration. This inflationary anxiety was further compounded by Federal Reserve Chair Kevin Warsh’s inaugural congressional testimony. In his prepared remarks, Warsh established an uncompromising tone, asserting that the central bank possesses zero tolerance for persistently high inflation and pointing to the structural resilience of the US labor market. By refusing to declare "mission accomplished" after a single soft inflation reading, Warsh effectively left the door wide open for at least one additional 25-basis-point policy hike before the end of the year. Financial markets, as tracked by the CME Group's FedWatch Tool, immediately responded by pricing in a high probability of another rate hike in either September or December, driving a swift recovery in Treasury yields and dampening the appeal of non-yielding bullion. Adding to the bearish undercurrent, geopolitical risk premiums are paradoxically supporting the US Dollar rather than safe-haven gold. The US military executed an additional series of surgical airstrikes targeting Iranian operations near the Strait of Hormuz, prompting quick Iranian drone and missile retaliation against coalition facilities in Gulf nations. Tensions reached a boiling point after US President Donald Trump issued a stern ultimatum, warning that Washington would expand its targets to include Iranian civil infrastructure, bridges, and power grids unless Tehran returns to active negotiations. This looming threat of an all-out regional escalation has spurred heavy precautionary accumulation of the highly liquid US Dollar. Although the Greenback’s overall index is lingering near multi-week lows following the soft CPI print—keeping gold afloat above the critical
$4,000 psychological cushion—the path of least resistance remains skewed to the downside as traders brace for the upcoming US Producer Price Index (PPI) and Warsh’s second day of congressional testimony.
XAU/USD TECHNICAL TREND STRUCTURE: CHANNEL MATRIX & PIVOTAL JUNCTURES From a structural charting perspective, the daily (D1) XAU/USD tape reveals that bullion remains confined within a dominant, medium-term downward parallel channel. It continues to trade well beneath its descending 200-day Simple Moving Average (SMA), validating a broader sell-on-strength regime.
1. Hardened Technical Barriers and Recovery Gates: For short-term buyers to stabilize the price action and neutralize the dominant bearish bias, they must engineer a high-volume breakout through the following structural layers:
The $4,100 Intraday Rejection Pivot: This psychological handle represents the immediate horizontal ceiling. Sellers aggressively stepped in at this level on Tuesday, confirming it as an active supply-side barrier.
The Upper Channel Boundary ($4,140.69): The primary technical trendline ceiling is currently anchored near
$4,140.69. While the Moving Average Convergence Divergence (MACD) has crossed into positive territory and is drifting higher, a daily candle close above this channel resistance is absolutely required to shift the broader trend bias from bearish to neutral.
2. Crucial Downside Liquidity Shelves and Expansion Targets: With the daily Relative Strength Index (RSI) hovering in a neutral-to-weak zone near
40.80, momentum indicators suggest that any structural break of immediate support could trigger rapid, systematic sell-offs:
The $4,000 Psychological Floor: This is the immediate defensive line in the sand. While a weaker US Dollar has helped gold preserve this level over the last 24 hours, a daily close below
$4,000 would likely trigger automated stop-loss liquidations, opening the door for a swift retest of the Year-to-Date (YTD) low at
$3,941.
The October 2025 Swing Low ($3,886.00): If the YTD low is breached with conviction, the next major historical demand anchor lies at the October 28, 2025 swing low of
$3,886.00, before exposing the lower channel boundary currently projected down near the
$3,718.03 support corridor.
* Phân tích thị trường được đăng ở đây nhằm mục đích nâng cao nhận thức của bạn, nhưng không đưa ra hướng dẫn để thực hiện giao dịch
 Tiếng Việt
 Русский
 English
 Bahasa Indonesia
 Bahasa Malay
 ไทย
ไทย Español
 Deutsch
 Български
 Français
 中文
中文 বাংলা
বাংলা हिन्दी
 Čeština
 Українська
 Română
