 Ethereum Range Compression: ETH/USD Tests $1,875 Pivot as Moving Averages Converge Ahead of Volatility Expansion
 Ethereum (ETH/USD) is currently navigating a pivotal H4 structural equilibrium around
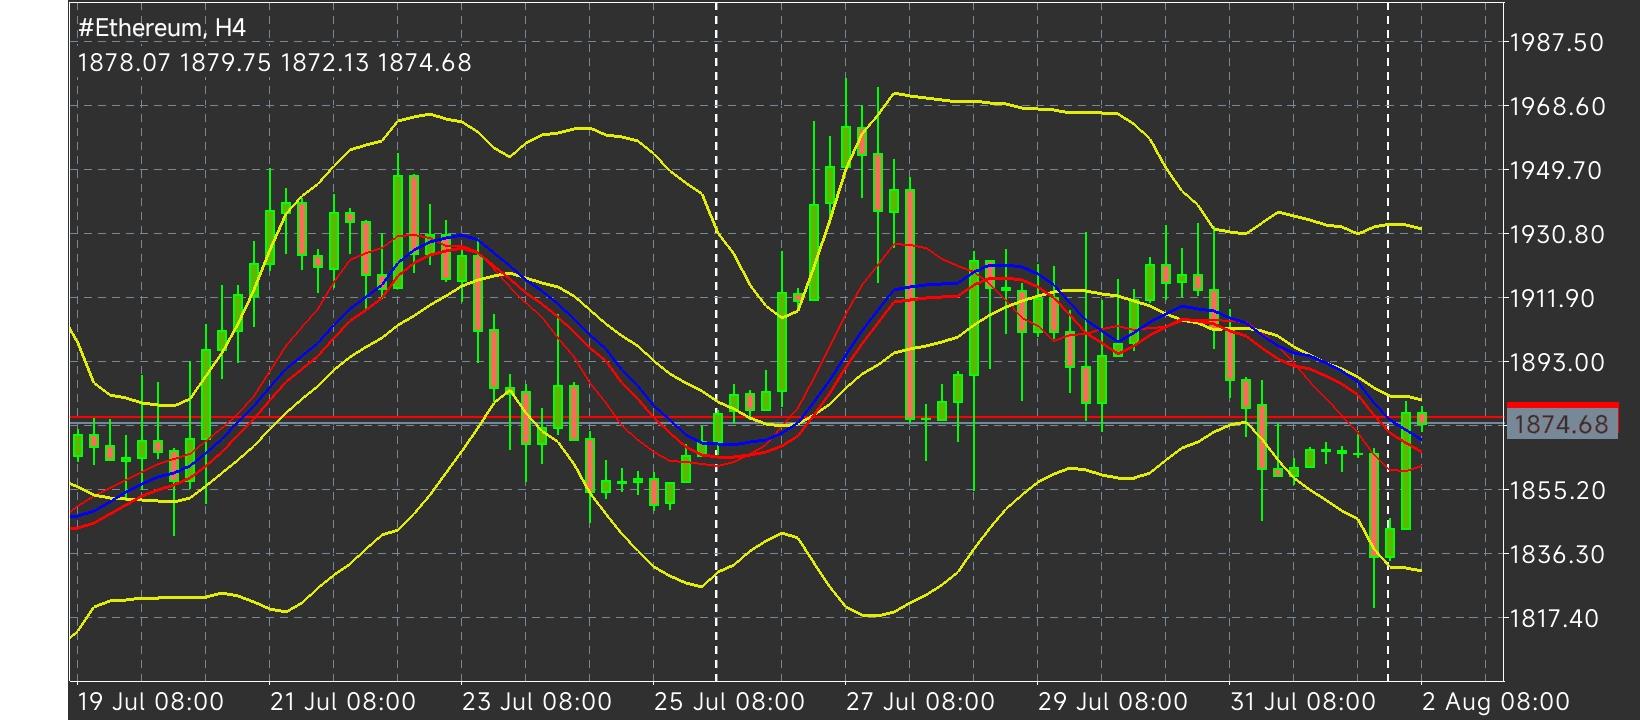
$1,874.68 after printing an intraday high of $1,879.75 and a low of $1,872.13 following an opening price of $1,878.07. Over the past two weeks, price action has resolved into a complex corrective consolidation following a sharp multi-stage impulse. This technical tightening has trapped price directly between converging Exponential Moving Averages (EMAs) and the H4 middle Bollinger Band, setting up a classic compression squeeze that typically precedes an intermediate trend expansion.
Multi-Phase Structural Analysis (19 July – 2 August): Phase 1: Supply Rejection & Volatility Expansion (19–23 July): The initial bearish leg originated at $1,930.80, driving ETH down toward $1,855.20. Key technical features included repeated rejections at the red and blue H4 EMA cluster near $1,911.90. Large bearish candles featuring extended upper wicks confirmed institutional distribution at this historical support-turned-resistance zone. The move caused a distinct expansion of the Bollinger Bands, culminating in a test of the lower band boundary near $1,855.20.
Phase 2: The Dominant Bullish Impulse (24–27 July): Buyers staged a decisive three-wave rally from the $1,855.20 swing low up to $1,978.60, cleanly breaking above overhead moving averages and closing beyond the upper Bollinger Band. Backed by broader month-end US dollar weakness and risk-on flows, the strong bullish candle on 26 July displayed minimal upper wick shadow. This rally tested critical macro distribution from early July, aligning with the 61.8% Fibonacci retracement of the preceding $1,930.80 to $1,855.20 decline.
Phase 3: Triangular Range Compression (28 July – 2 August): ETH entered a symmetrical range contraction characterized by a sequence of lower highs ($1,930.80, $1,911.90, and $1,879.75) and higher lows ($1,855.20 and $1,817.40). The sharp breakdown on 31 July tagged the lower Bollinger Band at $1,817.40 before triggering an aggressive bullish rejection wick back above $1,874.68, confirming active demand defense between $1,817.40 and $1,855.20.
Key Technical Levels & Moving Average Confluence: Overhead Resistance Architecture: Immediate dynamic resistance is stacked at
$1,885.00 (converging EMAs), followed by
$1,893.00. The primary institutional supply barrier rests between
$1,911.90 and $1,930.80, coinciding with the 50% Fibonacci retracement of the $1,978.60 to $1,817.40 impulse down. A sustained H4 close above $1,930.80 is mandatory to confirm a structural bullish trend resumption targeting
$1,968.60–$1,978.60.
Downside Support Architecture: Immediate structural support is anchored at
$1,872.13 and
$1,855.20. The primary demand floor spans
$1,817.40 to $1,836.30. A daily close below $1,817.40 would invalidate the higher-low sequence from 25 July and open downside liquidity pathways toward
$1,798.50.
Macro Drivers & Dual Scenario Outlook: While daily timeframe trendlines remain tilted downward under descending moving averages, the H4 Bollinger Band contraction indicates an imminent volatility expansion. Macro drivers remain balanced; firm US Dollar resilience and hawkish central bank expectations present headwind risks, while dips are being buffered by baseline crypto-market institutional demand.
Bullish Scenario (Breakout Above $1,893.00): Holding above $1,872.13 followed by a definitive H4 close above $1,885.00 and $1,893.00 shifts structural momentum toward $1,911.90. Clearing $1,930.80 confirms a full bullish extension targeting $1,978.60.
Bearish Scenario (Breakdown Below $1,855.20): Rejection at the $1,885.00 EMA confluence leading to a breakdown beneath $1,855.20 targets the lower demand shelf at $1,836.30–$1,817.40, with a risk of extending to $1,798.50 upon confirmation.
* Phân tích thị trường được đăng ở đây nhằm mục đích nâng cao nhận thức của bạn, nhưng không đưa ra hướng dẫn để thực hiện giao dịch
 Tiếng Việt
 Русский
 English
 Bahasa Indonesia
 Bahasa Malay
 ไทย
ไทย Español
 Deutsch
 Български
 Français
 中文
中文 বাংলা
বাংলা हिन्दी
 Čeština
 Українська
 Română
