 The Descending Channel Squeeze: BTC/USDT Tests Structural Liquidity Baseline at $62,243 Following Mid-July Distribution Peak
 The 4-hour chart for
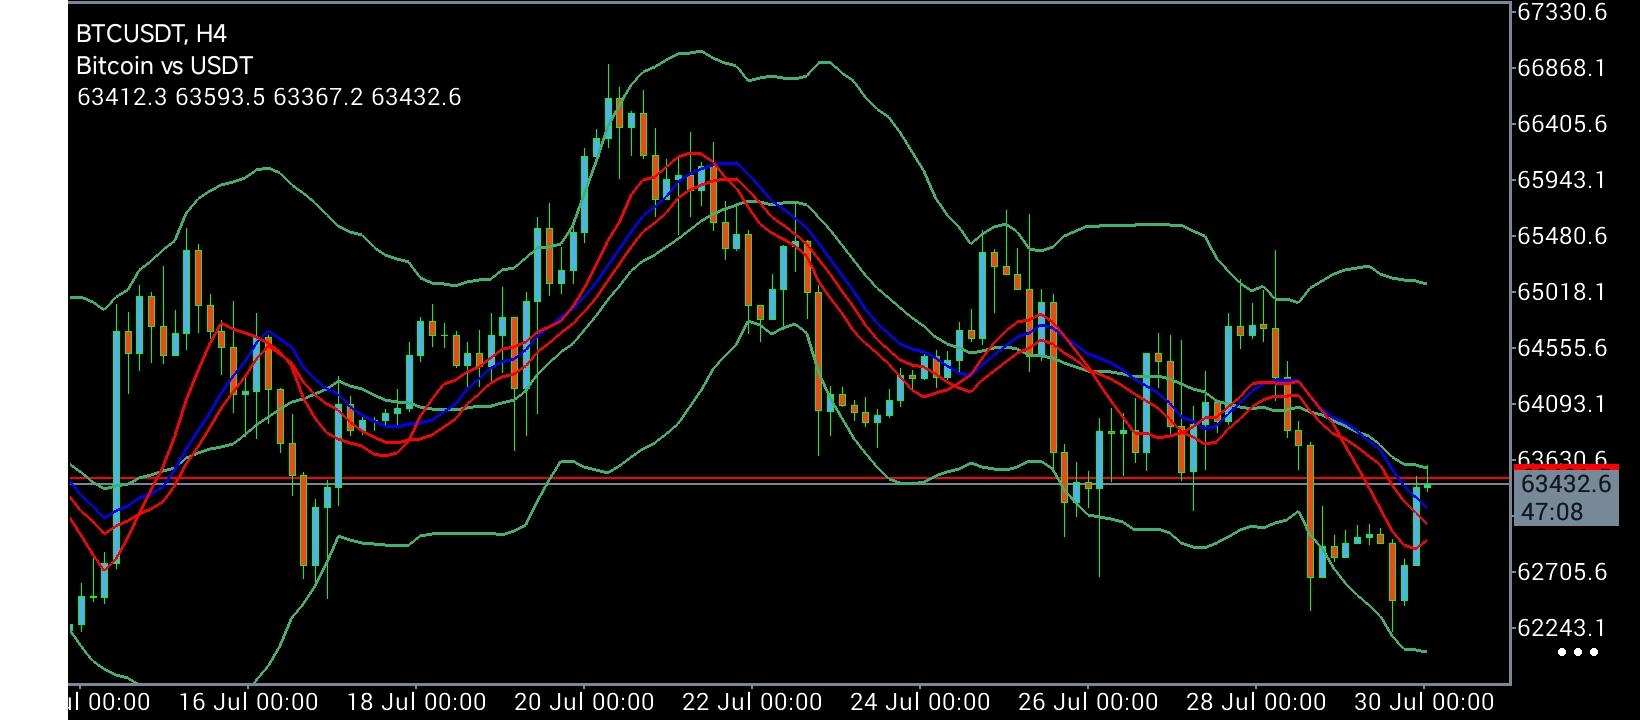
BTC/USDT over the late July to early August 2026 timeframe illustrates a textbook structural pivot from a powerful bullish impulse into a well-defined bearish descending channel. Following an aggressive rally that culminated in a peak near $66,868.1 around July 20—a push that stretched above the upper Bollinger Band and rode a steep cluster of short-term exponential moving averages (EMAs)—momentum rapidly evaporated. Exhaustion was confirmed by long upper wicks at the local high, triggering a sharp impulse downward that sliced through the midline of the Bollinger Bands as well as the 20, 50, and 200 EMAs. These key moving averages subsequently rolled over into a dynamic resistance barrier. The post-peak structural phase has since been dictated by systematic lower highs at $65,480.6, $65,018.1, and $64,555.6, alongside lower lows that culminated in a sell-off breaking the $63,630.6 floor and probing a major demand trough at $62,243.1. Currently consolidating near $63,432.6 within a tightening volatility squeeze, Bitcoin sits at a critical pivot where contractive Bollinger Bands precede an imminent directional expansion.
Technical Trend Structure: Dynamic Resistance & Volatility Squeeze Macro Resistance & Channel Top ($65,480.6 – $66,868.1): Defines the structural inception of the current downtrend. Reclaiming $65,943.1 and challenging the July peak at $66,868.1 is required to officially invalidate the higher-timeframe bearish Bias.
Intermediate Supply & Confluence Zone ($64,093.1 – $65,018.1): The primary overhead obstacle. A 4-hour close above $64,555.6 signals initial seller exhaustion, while breaking $65,018.1 shifts the short-term market structure back toward neutral-bullish.
Immediate Pivot & Resistance Flip ($63,630.6): Former horizontal support on July 26 that flipped into dynamic resistance. Clearing $63,630.6 is the baseline requirement for any meaningful recovery attempt.
Current Consolidation Floor ($62,705.6 – $63,432.6): The localized equilibrium zone where price is presently contracting within narrowing volatility bands.
Key Structural Demand Floor ($62,243.1): The primary swing low and lower Bollinger Band alignment. A sustained break below $62,243.1 confirms trend continuation and opens a direct path toward deeper downside liquidity.
Strategic Trading Decision Matrix: Setup Type Entry Trigger Primary Target (TP) Protective Stop (SL) Tactical Rationale Bullish Reclaim Long 4-Hour Close above
$64,555.6 $65,018.1 / $65,943.1 $63,900.0 Momentum trade exploiting the recovery above downward-sloping EMAs within the channel.
Demand Base Long Reversal Confirmation at
$62,243.1 – $62,705.6 $63,630.6 / $64,093.1 $61,850.0 Mean-reversion long entering at the lower Bollinger Band structural support floor.
Bearish Breakdown Short 4-Hour Close below
$62,243.1 $61,100.0 / $60,000.0 $62,950.0 Trend-continuation short trading the expansion out of contraction after losing key support.
* Phân tích thị trường được đăng ở đây nhằm mục đích nâng cao nhận thức của bạn, nhưng không đưa ra hướng dẫn để thực hiện giao dịch
 Tiếng Việt
 Русский
 English
 Bahasa Indonesia
 Bahasa Malay
 ไทย
ไทย Español
 Deutsch
 Български
 Français
 中文
中文 বাংলা
বাংলা हिन्दी
 Čeština
 Українська
 Română
