 Ethereum at the Crossroads: Technical Compression, Elliott Wave Correction, and Macro Convergence Target $2,066 Breakout
 Ethereum (
ETH/USD) completed a daily session on the D1 timeframe with a close at
$1,915.43, navigating a tight intraday channel between an open of
$1,917.74, a high of
$1,919.46, and a low of
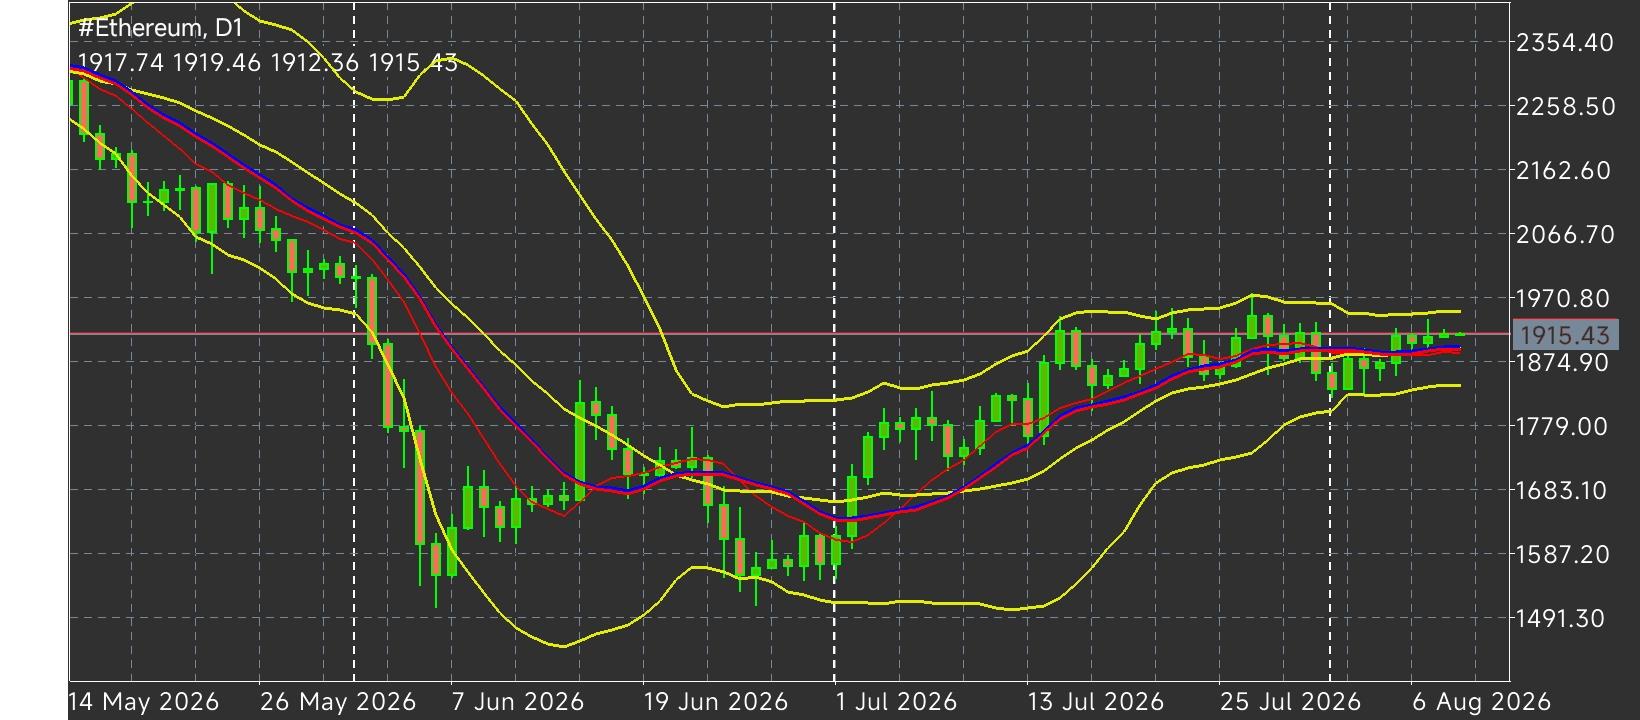
$1,912.36. This muted price action reflects a critical inflection point in the structural evolution of the asset, where a three-month multi-phase transition has shifted ETH from a aggressive five-wave bearish impulse into a complex corrective recovery now testing major macro supply zones. The primary phase from mid-May to July 1 unfolded as a textbook five-wave Elliott Wave decline, driving ETH from the
$2,354.40 peak down to an ultimate capitulation floor near
$1,587.20. This downward cascade was anchored by high-volume breakdown candles that sliced cleanly through key historical pivot levels at
$2,066.70 and
$1,970.80, forcing price action against the lower envelope of the yellow Bollinger Band boundaries. An interim mid-June base-building attempt between
$1,683.10 and
$1,779.00 failed to reclaim the short-to-medium-term moving averages (represented by the red and blue dynamic overlays), confirming persistent institutional sell pressure until exhaustion materialized at
$1,587.20. The secondary phase from July 1 through July 25 marked the primary recovery phase (Wave A), characterized by a sequence of higher structural lows (
$1,587.20,
$1,683.10,
$1,779.00, and
$1,874.90) and higher structural highs (
$1,683.10,
$1,874.90, and
$1,970.80). During this advance, Ethereum reclaimed its dynamic short-to-medium moving averages, forcing them to slope upward into dynamic support. The Bollinger Bands expanded to accommodate the rally as price rode the upper band directly into the 38.2% Fibonacci retracement level (
$1,970.80) of the entire
$2,354.40–$1,587.20 drop. Rejection wicks at
$1,970.80 on July 25 signaled temporary supply absorption and profit-taking, initiating the third phase of consolidation. Between July 26 and August 6, Ethereum entered a retest and compression phase (Wave B), establishing a narrow trading range between
$1,874.90 and
$1,970.80. The moving average ribbon has flattened and converged around the
$1,900.00 psychological baseline, while the narrowing Bollinger Bands indicate volatility contraction prior to an imminent directional expansion.
Technical Trend Architecture & Strategic Execution Map: Immediate Overhead Resistance Confluence: $1,919.46 (session high) and
$1,970.80 (July peak, 38.2% Fibonacci retracement, upper Bollinger Band alignment).
Macro Upside Extension Targets: $2,066.70 (50% Fibonacci retracement, May breakdown level) and
$2,162.60 (61.8% Fibonacci retracement).
Immediate Dynamic Support Layer: $1,912.36 (session low) and
$1,900.00 (converging moving average ribbon baseline).
Critical Structural Support Floor: $1,874.90 (higher-low structural pivot). Deeper downside buffers align at
$1,779.00,
$1,683.10, and the macro base at
$1,587.20. Major bearish extension target sits at
$1,491.30.
Macro & Elliott Wave Scenario Matrix: Bullish Wave C Continuation Scenario: A daily candle close above
$1,970.80 confirms Wave C impulse development, unleashing momentum toward
$2,066.70 and
$2,162.60. Supported by a weakening US Dollar and potential institutional spot ETF inflow triggers, a weekly close above
$2,066.70 would confirm a macro trend reversal from the May decline.
Bearish Breakdown Scenario: A daily close beneath
$1,874.90 invalidates the short-term higher-low structure, signaling a broader range contraction that exposes
$1,779.00 and
$1,683.10. A failure to hold the
$1,587.20 macro low would re-engage the primary downtrend toward
$1,491.30.
* Phân tích thị trường được đăng ở đây nhằm mục đích nâng cao nhận thức của bạn, nhưng không đưa ra hướng dẫn để thực hiện giao dịch
 Tiếng Việt
 Русский
 English
 Bahasa Indonesia
 Bahasa Malay
 ไทย
ไทย Español
 Deutsch
 Български
 Français
 中文
中文 বাংলা
বাংলা हिन्दी
 Čeština
 Українська
 Română
